There are two ways to check the RAy2 stations. You can actively query the station in the defined time intervals or you can just wait for the trap to be received.
If you have a defined item which is updated e.g. every 10 seconds. Zabbix requests a reply to the SNMP GET message for the specific OID object and it stores this value in the database at 10 second intervals.
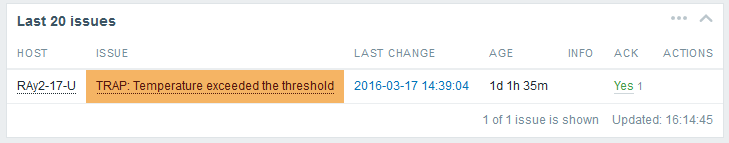
A trigger can also be configured for each item. For instance, temperature threshold alarm is set to 50°C. Whenever Zabbix receives an SNMP RESPONSE message from any monitored host with temperature higher than 50°C, an alarm is triggered. If the alarm is triggered, it is displayed at the Zabbix Dashboard. The Alarm will be visible in the “Last 20 issues” table and you will see which host is having an issue in the “Host status” table.
When the temperature falls back into the allowed range, the issue will be deleted from the Zabbix dashboard.
The key aspect of the SNMP are the TRAPS. These OID objects are not actively monitored by the Zabbix manager but by the RAy2 itself. For example, an RSS value is too low: RAy2 sends a trap to the defined IP address of your NMS (Zabbix) which triggers an alarm.
This, unfortunately, is a somewhat complex procedure. There are several ways to configure traps – only one of them will be explained in this guide.
| Note | |
|---|---|
Another approach could be using SNMPTT functionality. |
You have to install an snmptrapd, a daemon which receives SNMP traps and passes them into the Zabbix front-end.
You can use the script (snmptrap.sh) which is included in the RAy2_Zabbix_templ.zip file downloadable from RACOM website. Copy the script file into /usr/lib/zabbix/externalscripts/ directory and change the file privileges and make it executable.
# chown zabbix:zabbix /usr/lib/zabbix/externalscripts/snmptrap.sh
# chmod +x /usr/lib/zabbix/externalscripts/snmptrap.sh
After that, you need to edit the file. By executing
$ which zabbix_sender
you will find the full path to this executable binary file. Change the path in the file, e.g.
ZABBIX_SENDER="/usr/bin/zabbix_sender";
The script parses the output of each received SNMP trap, selects the appropriate host and declares an associative array containing trap descriptions. Eventually, it sends the whole message to your Zabbix server.
The script logs trap information into the /tmp/trap_messages.log file.
You should also check the LOG destination, which should be: /var/log/snmptrap/snmptrap.log. Create the directory if it is not already created and edit this in the snmptrap.sh script file.
LOGFILE=/var/log/snmptrap/snmptrap.log
| Note | |
|---|---|
The log file could also be located in /var/log/zabbix/snmptrap.log if required. |
Now we have our script prepared, let’s configure the Zabbix front-end:
If you have not done so, import the RAy2 template. One application is called TRAPS and it consists of all traps. Link the template to desired hosts.
| Note | |
|---|---|
If Zabbix receives a trap for an unknown host it will not be displayed. |
The host MUST be configured using the IP address as the Host name, e.g.:
Host name: | 192.168.10.1 |
Visible name: | RAy2-17-L-1 |
SNMP interface: | 192.168.10.1, port 161, IP |
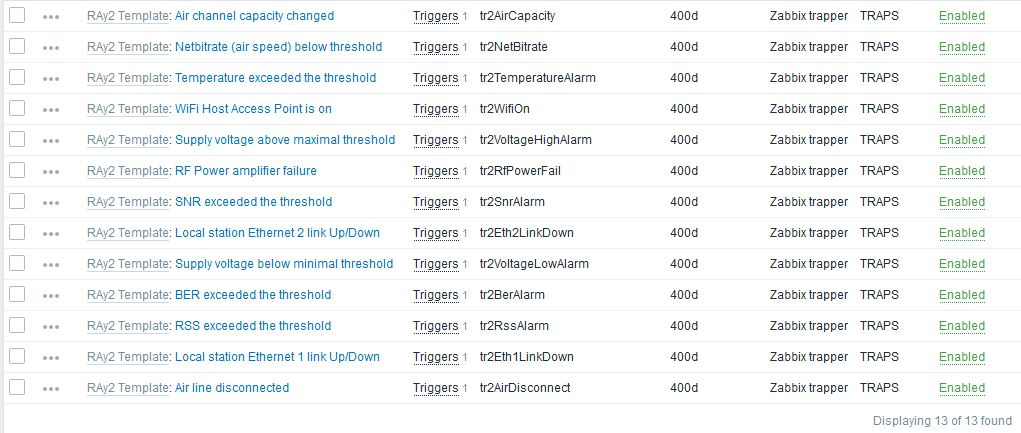
Along with this template, 13 new items and triggers appear at each used host. That is exactly the number of SNMP traps defined at the RAy2. Each trap should be recognized and the Zabbix should display the correct information message at the dashboard.
The template Application consists of 13 traps which correspond with number of traps implemented in RAy2.
RAy2 sends a trap whenever the watched value is out of range (or other configured condition is met) and whenever the value falls back within the corresponding range.
Every trap has two states in Zabbix. Each trap can either be in the alarm state (colors correspond to colors in the WEB interface) or in the OK state.
| Note | |
|---|---|
There is third trap state on the RAy2 WEB interface – “acknowledged”. This is not recognized automatically within the Zabbix frontend, but you can acknowledge the trap in Zabbix separately from the Dashboard menu. |
You can also define Zabbix to send you an e-mail whenever any trap is triggered. See the Zabbix Documentation or Chapter 9, Zabbix Alerting via e-mail of this Application not for the e-mail configuration.
Please, find the file snmptrapd.conf usually it’s in the /etc/snmp/ directory. Edit or create the file as root with the following lines:
authCommunity log,execute mwl-snmp
traphandle default /bin/bash /usr/lib/zabbix/externalscripts/snmptrap.sh
The first line will allow all received traps with community snmp-racom to be parsed and the second line will force the snmptrapd to use our script.
If you do not know what community names you will receive, add the following line to accept all community names.
disableAuthorization yes| Note | |
|---|---|
The default RAy2 community name is “mwl-snmp”, configure snmptrapd.conf accordingly. |
Do not forget to restart snmptrapd. You should have similar snmptrapd parameters in the /etc/sysconfig/snmptrapd file:
OPTIONS="-Lsd -p /var/run/snmptrapd.pid -On"
This ensures that snmptrapd daemon will not translate the numerical OID numbers which is important for our script to run properly.
| Important | |
|---|---|
If you install Zabbix on the CentOS distribution, do not forget to enable snmptrapd within SELinux security rules. |
SELinux is an important security part of CentOS. Running all the functionality of Zabbix will require configuring these rules. If you do not understand it, consult the required changes with our technical support.
Now Zabbix is ready to receive SNMP traps from all RAy2 stations and enter them into the database properly. In order to test it, force the trap to be sent from any RAy2 and see whether it appears in the Zabbix front-end. If not, check that the respective UDP port (162) is enabled at your firewall and check the settings again. You can also execute Tcpdump or Wireshark at the selected interface of your Zabbix server or somewhere along the intended packet path.
Another basic test can be run using the following command:
zabbix_sender -z localhost -p 10051 -s "192.168.10.1" -k tr2RssAlarm -o "tr2RssAlarm, ALARM: UP"The IP address of your RAy2 station is 192.168.10.1, key is “tr2RssAlarm” and the message for the Zabbix server is “tr2RssAlarm, ALARM: UP”. The command should trigger the host’s “RSS exceeded the threshold” alarm. Note that you need to have a host configured with this IP address, otherwise the trap will not be shown.
It is important to set the KEY value correctly, otherwise the trap would not match the trigger. See more KEY values with their description below:
tr2TemperatureAlarm – Temperature exceeded the threshold
tr2VoltageLowAlarm – Supply voltage below minimal threshold
tr2VoltageHighAlarm – Supply voltage above maximal threshold
tr2RssAlarm – RSS exceeded the threshold
tr2SnrAlarm – SNR exceeded the threshold
tr2BerAlarm – BER exceeded the threshold
tr2AirDisconnect – Air line disconnected
tr2Eth1LinkDown – Peer station Ethernet 1 link Up/Down
tr2Eth2LinkDown – Peer station Ethernet 2 link Up/Down
tr2RfPowerFail – RF Power amplifier failure
tr2NetBitrate – Air speed below threshold
tr2WifiOn – WiFi Host Access Point is on
tr2AirCapacity – Air channel capacity changed
If you want to clear the trap alarm, just repeat the same zabbix_sender command, but change the message to contain the word “DOWN”, E.g. “ALARM DOWN”.
| Note | |
|---|---|
Air channel capacity changed trap is, in fact, Event. RAy2 sends information about air capacity every time it is changed. In Zabbix, it is cleared after 5 minutes of being stable. |
You can also see Trap’s output in Monitoring → Latest Data → TRAPS of your RAy2 station → History. The displayed information differs based on the trap received. See the detailed description in the respective Zabbix item.