Controls
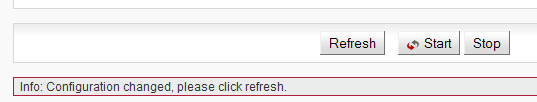
The following configuration buttons are used for configuration:
| Apply and save parameters. | |
| Set parameters are overwritten with original values. | |
| Reload the current values of the station / both stations.
Should the configuration be changed from other management session, the message Info: Configuration changed, please click refresh is displayed at the status bar (see screenshot lower). The Refresh button reloads valid data and refreshes web browser screen. | |
| Load default values of the parameters on the screen. To use any of these values, you must use the Apply button. | |
| Loads values of individual parameters from backup configuration. To use any of these values, you must use the Apply button. For loading backup configuration see menu Tools – Maintenance – Backup – Settings – Upload. | |
| Use the Start button to start automatic refresh of displayed information. Information subject to this update are highlighted with a refresh icon. | |
| Use the Stop button to stop automatic refresh of displayed information. |
Help
The microwave link configuration system is equipped with built in Help – see Help section. The Help is accessible in two forms:
Configuration parameter context help. The help text is displayed in the pop up window after clicking the parameter name.
The whole user interface help. The help text is displayed within the configuration screen after clicking the Help menu.
Secure login
You can login into the configuration interface either using the insecure http protocol or the secure https protocol – by click to go to secured version. You can select the connection method on the login screen. If the https protocol is used, it is not possible to tap the network communication and acquire the station’s login information.

Rollback function
If you interrupt the connection on an operating link by entering inappropriate radio link parameters, the original parameters will be restored after 1 minute. The connection is automatically restored.
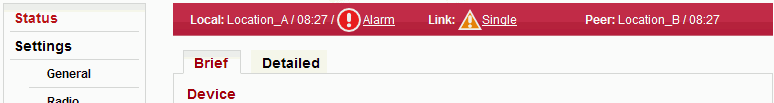
Status bar is located on the upper part of the screen below the title bar. It consist of 3 fields:
Local station status (station, user is directly connected to via its management IP address).
Local to Peer link status.
Peer station status.
Local and Peer field displays:
Station name according to configuration.
Actual time valid for respective station.
Warning or Alarm icon in case a warning or alarm occurs.
Link field displays:
Status of the link between both sides of the station.
Warning icon when the link is not capable of user data transfer.
Link status can be one of the following values:
| UNKNOWN | Station start up. The initialization is not yet finished. | |
| SETUP | Station initialization according to valid configuration. | |
| SINGLE | Station in operation status. Link to peer station is not established. | |
| CONNECTING | Connection to peer station in progress. | |
| AUTHORIZING | Authorization of the peer station in progress. | |
| OK | Link is connected. Peer station is authorized. | |
| ANALYZER | Spectrum analyzer mode active. User data are not transferred. |
All states, except the OK state, are highlighted by warning icon:
Menu Status – Brief and Status – Detailed contains basic information about local and remote (Peer) station. Information is refreshed manually by pressing the Refresh button, or automatically after pressing the Start button.
Status – Brief shows only the most important values. Status – Detailed provides further details. Below is a list of all values - according to the menu Status – Detailed.
The Device menu provides basic information about local and remote station. Informations are valid at the moment the page is open, or the Refresh button is pushed.
| Station type indicator. | |
| Station serial number. | |
| Station name selected by user. | |
| Unit location assigned by user. | |
| Station’s firmware version. | |
| The internal real-time clock. The clock is set manually or it is synchronized with NTP server and set for both stations. | |
| Temperature inside the station. | |
| Station’s power supply voltage level. |
| Radio unit type: L (Lower) or U (Upper) part of the frequency band. | |
| Horizontal or vertical polarization based on the
physical installation. Indicates the polarization of received
signal. Local and Peer are indicated separately. The proper
position of the cable is sideways down. Notice for ISM connections (RAy17, RAy24): One side of the link must be installed in vertical polarization and the other in the horizontal polarization. | |
| Displays the currently selected frequency table. | |
| Nominal width of the channel. Both units in a link have to use the same bandwidth. | |
| Used channels. Both number of the channel and frequency in GHz are listed. | |
| Modulation type currently used for transmitting. When adaptive modulation is enabled, the ACM letters are displayed as well as information about maximum permitted modulation: “current modulation ACM / maximum modulation” | |
| Current output power on the RF channel in dBm. If ATPC is enabled, the ATPC letters are displayed as well as information about maximum permitted power: “current power ATPC / maximum power” | |
| Current transfer capacity of radio channel for user data. | |
| The maximum RF channel capacity according to installed feature key. | |
| Received signal strength. If ATPC is enabled, the ATPC letters are displayed as well as information about threshold value for activation of power control loop: “current RSS ATPC / threshold RSS” | |
| Signal to Noise Ratio. If ATPC is enabled, the ATPC letters are displayed as well as information about threshold value for activation of power control loop: “current SNR ATPC / threshold SNR” | |
| Bit Error Rate registered at the receiving end. Instantaneous value. | |
| Time elapsed since the current link connection has been established. |
| Status of ethernet interface. Current bit rate (10 = 10BASE-T, 100 = 100BASE- TX and 1000 = 1000BASE-T) and state of duplex (FD = full duplex, HD = half duplex). | |
| Status of the internal crossover of ethernet cables. (MDIX = internally crossed pairs, MDI = direct connection, N/A means an unknown state). | |
| Switch blocking protection status. | |
| Switch Quality of Service status. |
| HW address of the ethernet module. | |
| IP address in the standard dotted decimal notation, including the bit width of netmask after the forward slash. | |
| Services enabled for station management and monitoring (HTTPS, SSH, Telnet SNMP, NTP). | |
| Service access via VLAN management only. |
Detailed traffic statistics in the user interface.
| Number of all received packets. | |
| Counter of unicast packets received. | |
| Counter of multicast packets received. | |
| Counter of broadcast packets received. | |
| Counter of all packet errors (including dropped). | |
| Counter of received packets, dropped. | |
| Counter of corrupted packets (CRC error) received. Usually indicates a problem on Eth cable or connector. | |
| Number of all outgoing packets. | |
| Counter of outgoing unicast packets. | |
| Counter of outgoing multicast packets. | |
| Counter of outgoing broadcast packets. | |
| Number of outgoing packet errors. | |
| Counter of dropped outgoing packets. | |
| Counter of detected collisions in transmission. |
Information on statistical data
| Time of log clearing. | |
| Period of log refresh. |
Radio link statistics
| Overall time the link has been connected. | |
| Overall time the link has been disconnected. | |
| The ratio of “Uptime” and “Downtime”. | |
| Current time the link has been connected. | |
| The longest downtime period recorded. | |
| Length of the last link interruption. | |
| Number of link interruptions. |
Setup of general parameters of the link.
| Station type indicator. | |
| Station serial number. | |
| Station name selected by user. | |
| Unit location assigned by user. | |
| Enable LED status indicators on the body of the station. You can turn off all LEDs with this option. | |
| The internal real-time clock. The clock is set manually or it is synchronized with NTP server and set for both stations. | |
| Time synchronization source setup. Manual setup or NTP protocol use. For easier diagnostics of link operation, it is recommended to use the NTP time synchronization. | |
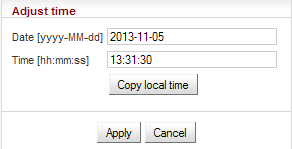
Manual time setup. Use the dialog box to manually set
the current date and time. You can copy time from browser
(local PC).
 | |
| IP address of the time synchronization server. | |
| Time synchronization interval. | |
| Time zone | |
| Enable daylight saving time |
| Note | |
|---|---|
When the time zone and/or daylight saving time is changed, the original values set in the RAy unit are kept. The actual change takes place after OS restart in order to prevent unexpected states related with local time change. |
Setup of general parameters of the radio link.
| Information about the type of radio unit: L(ower) or U(pper) band. | |
| Horizontal or vertical polarization based on the
physical installation. Indicates the polarization of received
signal. Local and Peer are indicated separately. The proper
position of the cable is sideways down. Notice for ISM connections (RAy17, RAy24): One side of the link must be installed in vertical polarization and the other in the horizontal polarization. | |
| One of standard channel widths can be selected. This parameter must be set identically in local and remote. | |
| TX and RX channels are selected from a
list of channels. The basic configuration has the TX and RX
options interconnected. In this case the basic duplex spacing
between channels is preserved and by selecting one channel,
the other three are defined as well. For stations operating in
free bands, it is possible to disconnect the TX-RX lock and
select TX and RX channels individually. Corresponding channels
at peer station are set automatically. Notice – Non-standard duplex setting leads to non-effective use of the spectrum. | |
| Information about duplex spacing of TX and RX channel. | |
| Enable automatic control of modulation. | |
| Modulation level for TX channel. You can select in range from QPSK (high sensitivity for difficult conditions) to 256QAM (high speed under appropriate conditions). In case of enabled ACM it has the meaning of the maximum (highest) allowed modulation. | |
| Enable automatic control of RF power. Power is regulated towards lower values while maintaining highest modulation level. Maximum output power is limitted by Tx power parameter. The power control loop is primarily controlled by RSS. The SNR value is taken into account as well, because the situation of high interference value can lead to high RSS but low SNR. | |
| Desired output RF power. In case of enabled ATPC it has the meaning of the maximum allowed power. | |
| Only for links operating in the ISM band (RAy17,
RAy24). Gain of used antenna. It is used to calculate approximate EIRP. | |
| Only for links operating in the ISM band (RAy17,
RAy24). Approximate calculation of EIRP. Number on the right shows the allowed EIRP limit. Sign between numbers gives information on compliance/non-compliance with allowed EIRP limits. |
Ethernet interface physical layer parameters setup.
| Switching between transfer speed and flow control automatic negotiation or manual setting. | |
| Media Dependent Interface Crossover enables working with both types of ethernet cables, straight-through and crossover. The default option “auto“ switches on automatic detection and performs an internal crossover if necessary. | |
| Mechanism for temporarily stopping the transmission of data on an ethernet network. Enabling flow control allows use of buffers of connected active network elements for levelling uneven flow of user data. If flow control is enabled, you cannot use the built-in QoS functions. For correct operation it is necessary to also enable Flow control on the connected device. | |
| Setup of maximum allowed length of Ethernet frame. If transfer of tagged frames is not needed, you can choose smaller MTU. If you select smaller MTU, more storage space is available for QoS. | |
| The RAy unit uses one VLAN id for internal needs. It can be changed if there is a conflict with user data. |
Protection against packet flooding and subsequent device input switch blocking:
| traffic directed to broadcast address (DA=FFFFFFFFFFFFH) | |
| traffic directed to multicast addresses (DA[40]=1B) | |
| un-learned unicast traffic | |
| Setting the threshold to activate protection. Set as number of packets per 50ms. Set separately for 10Mb link speed, or for 100Mb and 1Gb link speeds. |
The Quality of Service (QoS) menu groups together multiple options of manipulating user data flow.
Ingress policing – causes user data flow to be limitted to certain value. The excessive packets are discarded.
Enable Ingress policing. Applies to the device user port. | |
Data rate to limit the Ethernet traffic to. If this speed is exceeded, Flow control is initiated. If packets are still incoming, they are dropped. | |
Ingress policer operation mode:
|
| Warning | |
|---|---|
The Ingress policing activation deactivates the switch QoS functions. |
Setup of QoS controlled by priority bits according to IEEE 802.1p.
Enabling QoS according to 802.1p | |
If priority control is enabled according to DSCP and incoming packet is coloured both by 802.1p priority and by DSCP – prioritization is governed (when enabling this option) by the DSCP rules. | |
Arranging individual priorities (coded in priority bits according to IEEE 802.1p) into selected output queue (0..3). |
| Warning | |
|---|---|
The QoS activation deactivates the Flow control and Ingress policing. |
Setting of QoS governed by DSCP priority bits (Differentiated Services, or DiffServ) in the IP header.
Enabling QoS according to DSCP | |
Arranging individual priorities (coded in DS field of IP header) into selected output queue (0..3). |
| Warning | |
|---|---|
The QoS activation deactivates the Flow control and Ingress policing. |
Setting of QoS governed by number or range of TCP/UDP ports.
Enabling QoS according to TCP/UDP ports. | |
If priority control is enabled according to DSCP and incoming packet is coloured both by DSCP priority and matches one of the rules listed here – prioritization is governed (with this option enabled) by the DSCP rules. | |
Up to 8 ranges of TCP/UDP ports can be configured. The range applies to both protocols: TCP and UDP.
|
| Warning | |
|---|---|
The QoS activation deactivates the Flow control and Ingress policing. |
Setting the operation mode of output queues. These are internal switch queues for organization of packets based on individual QoS rules.
| Note | |
|---|---|
To enable configuring output queues, you must enable at least one of the QoS rules. |
Regime for sending out packets from individual queues.
| |
Turns on the WFQ regime sending out ratio. | |
Setting parameters (ratios) of packets sending out for individual queues.
|
Setting mode for packet dropping in case of insufficient output channel capacity. Packets are dropped with certain probability before the queue is filled completely. For example, this mechanism prevents blocking of high priority packets by low priority packets. The “early random discard” mechanism is proving to be useful particularly for TCP traffic.
Smart discard mode can be used independently of QoS. To ensure correct function of Smart discard (i.e. Mode 1..3) Flow control is off.
Setting drop mode for individual output queues
|
| Warning | |
|---|---|
The Smart discard mode activation deactivates the Flow control. |
Access routes for link configuration.
List and setup of users. There can be different users on either side of the link.
| List of users on Local and Peer stations. |
| User name. This name is entered as Login to log into the link management. | |||||||||||||||||||
| |||||||||||||||||||
| Information about whether user has a password | |||||||||||||||||||
| Information about whether user has at least one ssh key defined. | |||||||||||||||||||
Edit user
Clicking Edit next to a username opens a screen with configuration of the given account.
 |
| User name | ||
| The group to which the user belongs. | ||
| Password can be set or deleted. Delete – User will not have a password. The user will only be able to log in with a ssh key. In order to delete the password, you must first upload ssh key. Set – Password settings. | ||
| New password. | ||
| Repeat password. | ||
| Working with ssh key. Delete – Clear all ssh keys of the user. Set/replace – Add a new key. If there already was any key(s), it will be overwritten. Add – Add a new key. You can enter multiple ssh keys this way. | ||
| Insert key file. | ||
Save the menu content by clicking on the button Apply. | ||
Delete user
| Users from the group cli_super have a Delete button next to them. You can delete a user using that button. User is removed without further queries. Users from the group cli_super cannot be deleted. |
Add user
| The button is located on the bottom bar. | |
| For users from the group cli_super, the Add user button is active. You can use it to create a new user from groups cli_quest or cli_admin. |
| Name of new user. | ||
| The group to which this user will belong. | ||
| Password for this user. | ||
| Repeat password. | ||
| If you want the user to have access using ssh protocol and identity verification using ssh key, enter the ssh key here. | ||
| Create a new user by clicking on the button Apply. | ||
Mirror users
| The button is located on the bottom bar. | |
| For users from the group cli_super, the Mirror users button is active. Selecting this function will copy all user accounts from Local station to Peer station. Existing user accounts on the Peer station are deleted (except for the password of distributor, which is unique for each station). |
Diagnostic system of the link monitors the operation of the station. It generates various events as output. There are two kinds of events: Warnings and Alarms. The event is always written to the system log and indicated in the status bar. Some events have configurable thresholds. For each event you can choose whether a SNMP trap should be sent if the event occurs.
List of configurable events with default thresholds:
Warning
| Temperature inside the station (on the modem board.) | ||
| Memory usage. | ||
| Lower threshold of supply voltage. | ||
| Upper threshold of supply voltage, SNMP
trap on/off is generated same as for Voltage min. | ||
| Received signal strength. | ||
| Signal to Noise Ratio. |
Alarm
| >10e−6 | Bit Error Rate registered at the receiving end. Instantaneous value. | |
| Interruption of radio link. | ||
| User eth link on Peer station interrupted. | ||
| Loss of transmit power (not for RAy17 neither RAy24). |
Station continuously stores information about the values of important variables:
Instantaneous value of temperature inside the station. Measured on the modem board. Temperature of radio board is available via SNMP. | |
Instantaneous value of station supply voltage. | |
Received signal strength. | |
Signal-to-noise ratio of the received signal. | |
Instantaneous bit error rate on link. | |
Instantaneous transmission capacity. | |
Instantaneous speed (20s average) of incoming user data on the user Ethernet port. | |
Instantaneous speed (20s average) of outgoing user data on the user Ethernet port. | |
Instantaneous value of transmission power. |
The values are saved in the following resolutions and history lengths
Resolution 1 minute, length of history 1 week
Resolution 15 minutes, length of history 30 days
Resolution 1 day, length of history about 180 days
Stored values can be viewed using three methods:
| Preview all values for the last 24 hours | |
| Detailed graphical view of one or two selected values for the given interval | |
| Numerical view of all values |
Viewer
Detailed graphical view of one or two selected values for the given interval. You can choose to view data from Local or Peer or both.
| Selecting one of the observed values. | |
| Selecting a second value. | |
| Enables the display of alarms, if there were any. | |
| Displays graph from Local unit. | |
| Displays graph from Peer unit. | |
| Selecting width of interval to be displayed. Based on the interval width, data are displayed in a suitable grid: Up to 3 hours in at one minute. Up to 4 days at 15 minutes. For longer intervals at one day. | |
| Move by one width of selected interval towards older values. | |
| Move by one width of selected interval towards newer values. | |
| Move to the newest values. |
Data
Detailed graphical view of values for selected interval.
| Shows only the values that are selected for the graph. | |
| Shows all logged values. Filtering of values from local, remote or both. | |
Shows internal station logs. Individual tabs allow total or filtered view.
When you first open the screen, it is necessary to start browsing logs by pressing the Refresh button.
Listings of all logs can be filtered. You can enter text in the upper left corner window for filtering listings. For example, you want to know when was the configuration of the station modified: On the Local events screen, enter “Configuration” and hit Enter.
You can use plain text or regular expressions for filtering (JavaScript format).
| Displays the last 3 records from all types of logs. | |
| Events from Local or Peer station. | |
| History of modulation switching if ACM is enabled. Local and Peer station. | |
| Alarms from Local or Peer station. |
Maximum length of displayed logs is 250 entries. If you need to display longer history, use of CLI interface is needed.
Menu Tools contains several support tools for link diagnostics and management.
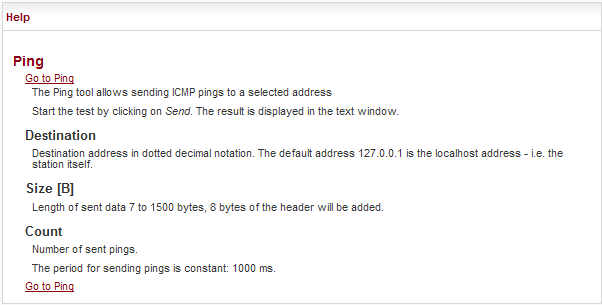
The Ping tool allows sending ICMP pings to a selected address
| Destination address in dotted decimal notation. The default address 127.0.0.1 is the localhost address – i.e. the station itself. | |
| Length of sent data 7 to 1500 bytes, 8 bytes of the header will be added. | |
| The period for sending pings is constant: 1000 ms. | |
| Number of sent pings. |
Start the test by clicking on . The result is displayed in the text window.
Graphical indication of BER, SNR and RSS.
| One-time update of displayed values. | |
| Use the Start button to start automatic update of displayed values with a period of 1 second. Use the Stop button to stop it. |
Constellation diagram shows the quality of received signal.
| Number of plotted points. | |
| One-time update of diagram. |
A very useful tool for identifying in-band interference and locating a free channel. It is not a full-blown spectrum analyser as it scans the spectrum with 7MHz channel resolution. The accuracy of measured results is given by the accuracy of measuring RSS.
| Warning | |
|---|---|
Running spectrum measurement causes interruption of user data flow between stations! |
| Selection of measurement length in range: single sweep … up to 15 min | |
| The deactivation of Peer station transmission during measurement. | |
| Opening analyser functions | |
| Interrupts communication on the link and starts scanning frequencies in the band. |
Restart of selected unit, Local or Peer. Warm – reboot management system.
Cold – restart the whole station as if power was removed.Performs the selected restart. Backup
Settings
Saving and restoring configuration.
Saving configuration to backup file. Upload configuration from a backup file into buffer. RAy continues to run with the current configuration. Restoring the configuration parameters from the buffer. Parameters must be prepared using Upload. Applying default values to all configuration parameters. Factory settings
Using the factory settings function will return the unit to its original state. All configuration items, user accounts, measured values and system messages (logs) will be irreversibly deleted.
![[Warning]](/images/radost/images/icons/warning.png)
Warning This task takes a few minutes to complete. Do not interrupt the power supply during the operation.
Applying Factory settings to Local station. Users
Saving and restoring user accounts.
Saving user accounts to backup file. Restoring user accounts from a backup file. Management Information Base
Provides MIB table. Diagnostic package
To facilitate communication with the technical support you can create an archive file with detailed information about the station. If connection with Peer station is functional, information from both stations is saved.
Saving a file with information about the station (Local and Peer). The sub-set of RAy parameters is affected by use of Feature keys.
The feature keys limiting data transfer speed [Mbps] are now available. Speed of the transferred data is determined by a combination of the radio channel bandwidth (parameter Bandwidth [MHz]) and modulation order (parameter TX modulation). The Feature key limiting the data transfer speed enables only certain combinations of the channel bandwidth and modulation order to get the data transfer speed according to the Feature key. The data transfer speed is typically slightly higher than declared.
When installed, the Feature key is activated after the station restart. The station can be restarted using the Tools-Maintenance-Restart menu. Choose the warm Restart mode.Local
The active Feature keys in the Local station. Name of the function controlled by the Feature key. The numeric value set by the key. The specific Feature key can be deleted using the Delete button. The parameters controlled by this Feature key are reset to their default values after the station restart.
Note: The link radio parameters can be changed subsequently (e.g. to a different operating frequency)!Feature keys are installed into the station from the binary files. Dialog for the Feature key binary file selection is open. Peer
Peer station active Feature keys. Feature keys of the Peer station are only displayed. They can be neither added, nor deleted. To be able to manipulate the Feature keys, it is necessary to access directly management interface of the relevant station – use the IP address of the relevant station. Name of the function controlled by the Feature key. The numeric value set by the key. Firmware
If a new firmware version is released for the given microwave link type, you can upload it to your RAy units.
Firmware upgrade
Information about the current firmware version on Local and Peer station. Information about firmware version prepared in the buffer for installation into the unit (Local, Peer). This firmware must first be prepared in the Firmware upload section (see below). You can use the Clean buffer button to delete prepared firmware package in the buffer. Firmware upload
Name of the firmware file Size of the firmware file Opens a dialog for uploading firmware package to the unit buffer. Only after firmware has been prepared in the buffer, you can perform the actual upgrade. Use the Upgrade button on the bottom bar to perform the firmware installation. Warning Installing the firmware takes several minutes (about 10 minutes). During this time, transmission of user data is interrupted (for about 8 minutes). Do not interrupt the power supply during firmware installation!
Radio type
![[Important]](/images/radost/images/icons/important.png)
Important Applies only to links operating in the ISM band (RAy17, RAy24).
Hardware of these links is universal for the entire frequency band. To facilitate the configuration of radio parameters, units are coded for L (Lower) and U (Upper) part of the band. L or U band assignment can be modified.
Radio unit type: L (Lower) or U (Upper) part of the frequency band.
Use the Change button to change the radio type.Frequency tables
The microwave link contains one or more frequency tables. These tables contain the following information:
List of available bandwidths and modulations.
Assignment of frequencies to the channels and the names of these channels. These channels are used to configure radio parameters of the link (see screen Settings-Radio).
Default values of radio parameters.
A set of radio parameters, needed for the ATPC operation.
Name of the currently used frequency table. Select a new frequency table. Use the Change button to change the table. Warning Using the wrong frequency table can lead to violation of the corresponding telecommunications regulations.
The Help screen displays contents of the embedded help. The help text is displayed in the whole configuration window. The text structure corresponds to individual configuration screens.
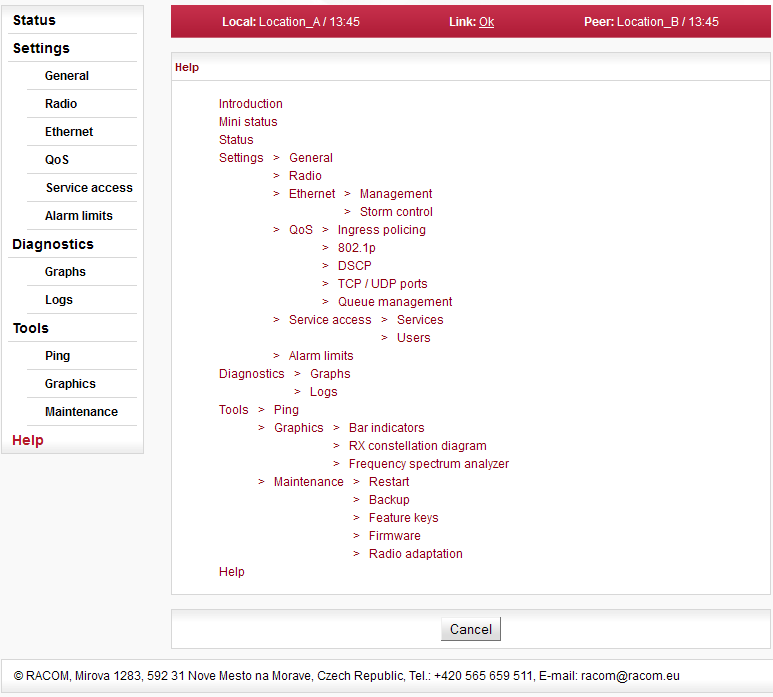
Every item of this Help opens the specific menu help.
Clicking the name of the specific parameter in the configuration menu brings the help belonging to this parameter. The help text is displayed in the pop up window:
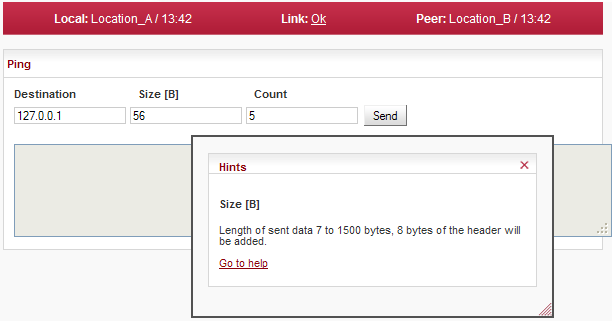
The window can be moved by dragging the Hints bar. Resize it by dragging the bottom corner.
There is a Go to help link within the help text. The whole configuration menu help text is displayed by clicking this link:
There is a link at the beginning and end of each help screen which points to the respective configuration screen.