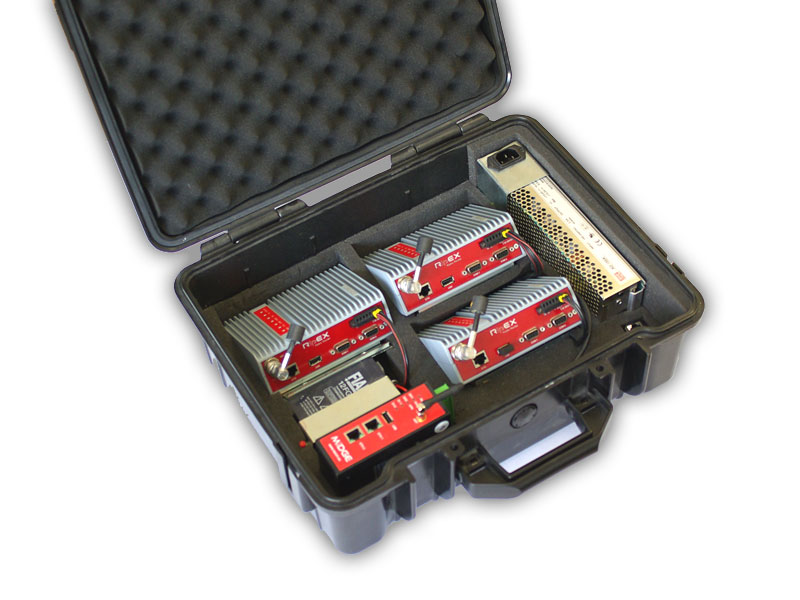
RipEX Demo case should answer most of your questions regarding the RipEX product and give you a quick and easy summary about the product itself.
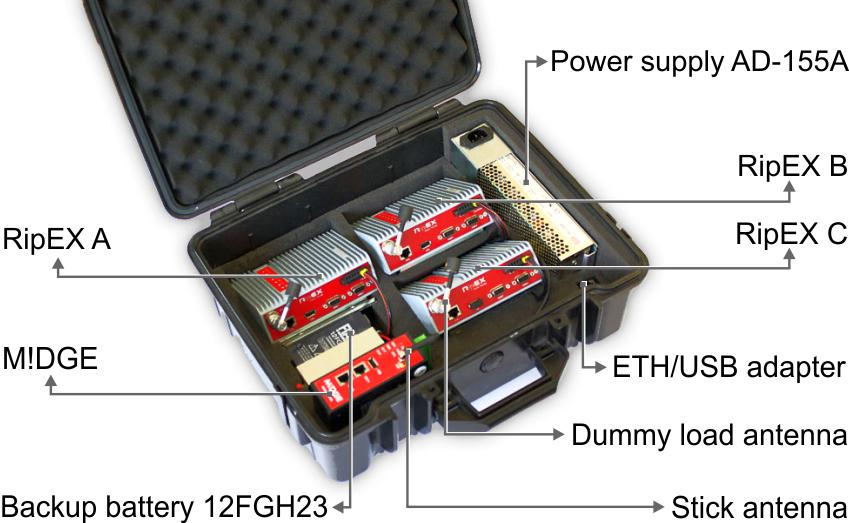
There are three RipEX units and one M!dge unit in the case. All units are in the default state.
See the following chapters for a detailed description.
Brackets and cabling for installation of three RipEXes and one M!DGE (units are not part of the delivery)
1× power supply Mean Well AD-155A (100-240 V AC 50-60 Hz/13.8 V DC)
1× Backup battery (12 V/5 Ah, FASTON.250), e.g. Fiamm 12FGH23
1× Power cable (European Schuko CEE 7/7 to IEC 320 C13)
1× Ethernet patch cable (3 m, UTP CAT 5E, 2× RJ-45)
Quick start guide
3× Dummy load antennas
1× L-bracket, 1x Flat-bracket samples
1× ETH/USB adapter
1× Wifi adapter
Your PC will get its IP settings from the built-in DHCP server and you have to type http://10.9.8.7 in your browser. Remaining steps are the same and you do not need to worry about other RipEX’es, since you will be connected to the local unit in all cases.
Wifi adapter for service access to the web interface via USB connector. Includes a built-in DHCP server which provides up to 5 leases. To access the RipEX always use the fixed IP 10.9.8.7.
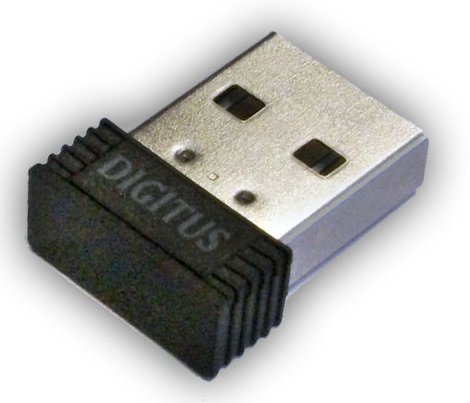
We recommend using the “W1” – external Wifi adapter (an optional accessory of the RipEX). Connect your PC or tablet or smart phone to RipEX Wifi AP first. Its default SSID is “RipEX + Unit name + S/N”. The W1 contains a built-in DHCP server, so if you have a DHCP client in your PC (as most users do), you don’t need to set anything up. The RipEX’s IP address for access over the ETH/USB adapter is fixed: 10.9.8.7.
To configure a RipEX you can connect it to your PC in two ways:
Using the – external ETH/USB adapter
Directly over the ethernet interface
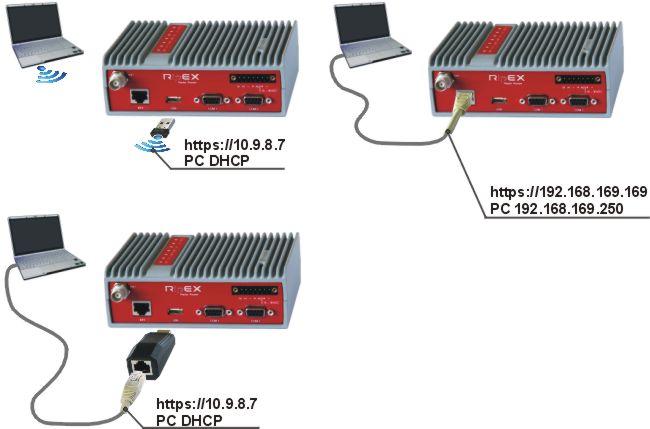
PC connected via ETH/USB adapter
We recommend using the “X5” – external ETH/USB adapter (an optional accessory of the RipEX). The ETH/USB contains a built-in DHCP server, so if you have a DHCP client in your PC as most users, you don’t need to set anything up. The RipEX’s IP address for access over the ETH/USB adapter is fixed: 10.9.8.7.
Go to 3. Login to RipEX
PC connected directly to ETH port
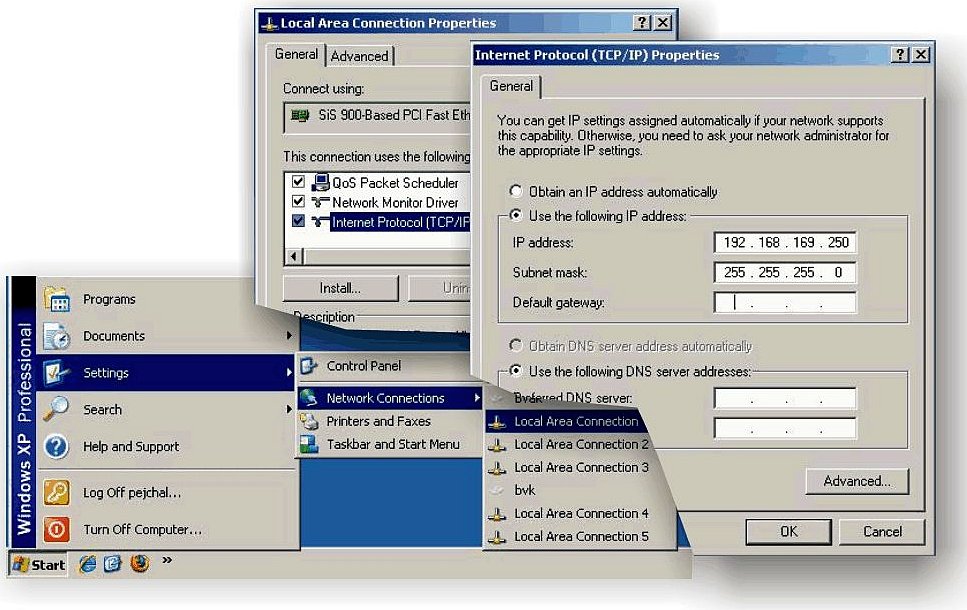
Set a static IP address in PC, example for Windows XP:
Start > Settings > Network Connections > Local Area Connections
Right Click > Properties > General
select Internet Protocol (TCP/IP) > Properties > General
IP address 192.168.169.250 – for RipEX in the default state
Subnet mask 255.255.255.0
Default gateway leave empty
OK (Internet Protocol Properties window)
OK (Local Area Properties window)
Some Operating systems may require you to reboot your PC.Note: When you change the RipEX ETH address from the default value later on and the new IP network does not include the default one, you will have to change your PC’s static IP again to be able to continue configuring the RipEX.
Login to RipEX
Start a web browser (Mozilla Firefox, Internet Explorer – JavaScript enabled) on your PC and type the RipEX’s default IP in the address line field:
10.9.8.7 – when connected via “X5” – an external ETH/USB adapter. IP address 10.9.8.7 is fixed and cannot be changed; it is independent of the IP address of the RipEX’s Ethernet interface.)
192.168.169.169 – when connected directly to ETH
![[Note]](/images/radost/images/icons/note.png)
Note https – For security reasons the communication between the PC and RipEX is conducted using the protocol https with ssl encryption. The https protocol requires a security certificate. You must install this certificate into your web browser (Mozilla Firefox, Internet Explorer). The first time you connect to the RipEX, your computer will ask you for authorisation to import the certificate into your computer. The certificate is signed by the certification authority Racom s.r.o. It meets all security regulations and you need not be concerned about importing it into your computer. Confirm the import with all warnings and exceptions that your browser may display during installation.
The login screen appears:
The default entries for a new RipEX are:
User name: admin
Password: admin
Click OK.Initial screen should appear then:
Warning: Before you start any configuration, make sure only one unit is powered ON. Otherwise, a different radio modem could reply to your requests! (All units share the same IP address and are in Bridge mode when in factory settings.)
IP address unknown
If you don’t have the adapter or you have forgotten the password, you can reset the access parameters to defaults, see chapter Reset button in RipEX manual.
RipEX Demo case gives you the most straightforward way to discover and understand all RipEX features and functionalities. Pay attention to the Settings tab, where one can set most configuration parameters. A few clicks will give you an easy summary about the product faster than reading many pages of text.
For detailed parameter descriptions, click on the button. Kindly note, balloon tips are also available for some parameters.
Keep in mind that accessibility of some parameters depends on the settings of other parameters. For example serial SCADA protocols on COM ports can only be set when Operating mode is set to the Router mode.
The easiest procedure to configure the units in real usage is to use our Wizard feature. Click on the Wizard tab to be guided through all necessary settings. The Wizard will provide you with helpful notes for respective parameters.
In this application note, we will use the following basic scenario:
RipEX A: 192.168.1.101/24
RipEX B: 192.168.1.102/24
RipEX C: 192.168.1.103/24
After successful connection to the RipEX unit, go to the Wizards menu.
Leave everything in the default state except IP address and unit name. See the example for RipEX A.
After the Wizard is completed, click on the “OK” button. You will be forwarded into the Settings menu. Click on the “Apply” button and accept the changes.
Repeat the procedure for other RipEX units. Do not forget to use the appropriate IP addresses and Unit names.
Since the best way to understand the product is through practice, we have described a few practical tests you may wish to conduct.
Ping is the basic tool for checking connectivity between two hosts with IP addresses. Because RipEX is a native IP device, ping can also be used for radio link testing.
Go to the Ping tab in the Diagnostic menu. You can either set the Ping Type to „ICMP“ (common ping) or to „RSS“. The RSS type is a RipEX proprietary ping with extended reports.
The destination is the remote RipEX’s IP address. For example when you are locally connected to RipEX A (192.168.1.101), fill in 192.168.1.102.
When Ping is started, you will see the following on-line report on your screen.
When the specified count of ping packets is transmitted, following detailed summary is displayed. It consists of: throughput usage, PER/BER, RSS, Data Quality (DQ) and Round Trip Time (RTT) histogram. It can be very useful during RipEX unit installation and coverage optimisation.
Please read the detailed Ping report description by clicking on the Help question mark.
Feel free to change the packet length (Ping option) or the Modulation rate (Settings tab) in order to see the impact on the measured RTT. Do not forget to set the same Modulation rate in both units.
You can also check the end-to-end connectivity by connecting two PCs to RipEX units (see the following diagram).
RipEX units are already configured in the Bridge mode. We need to configure PCs with unique IP addresses within the network subnet (192.168.1.0/24). For example 192.168.1.10 for PC 1 and 192.168.1.254 for PC 2. A description of how to set a static IP address in your Windows PC can be found in Section 3.4, “Programming RipEX via Computer”.
Check the connectivity by executing a ping command.
To run this command in Windows, you need to execute Windows Command Processor (cmd). Click on the Start button and then type Command Prompt or cmd in the Start Search field. Select the Command Prompt icon.
After the Command Prompt window appears, type “ping 192.168.1.254” if you are
executing the ping from the PC with IP
192.168.1.10 and check the results. You can also try
the other direction, just switch IP addresses. See the following
example:
| Note | |
|---|---|
If the ping is not successful, try to turn the Windows firewall off. It can block the ping packets. |
Fast Remote Access is a unique RipEX feature used to minimize the data amount transferred when accessing the Remote station over the radio channel. The trick is that we do not transfer static data (e.g. web page graphical objects). All static data are downloaded from the local RipEX and only information specific to the remote RipEX is transferred over the radio channel.
To test this feature, just click on the Fast remote access button at the top of the screen, fill in the remote RipEX IP Ethernet address and click on the Connect button.
In the following example, we are locally (Ethernet) connected to RipEX A and we want to connect remotely to RipEX B.
Now you are accessing the remote unit over the radio link. The latency is dependent on the radio link Modulation rate. Feel free to change the Modulation rate (Settings tab) in order to see the impact on the remote access response time. Do not forget to set the same Modulation rate in all units you want to access.
Click on the Disconnect button to logout from the remote unit.
You can also try to access the remote RipEX unit without using Fast Remote Access feature. When locally connected to RipEX A, just type RipEX B’s IP address (192.168.1.102) into the browser and wait for the page to load.
You will see a huge impact on the access time. Again, feel free to change the Modulation rate (Settings tab) or changing the default Bridge mode to the Router mode.
| Note | |
|---|---|
You need to configure routing accordingly if the Router mode is active. |
The Demo case also contains a red light emitting diode connected to the RipEX A using HW alarm output, see Fig. 3.19, “Red light emitting diode using the Alarm output”. Generally, you can define conditions when RipEX is in the alarm state. E.g. when the temperature is out of its threshold range, HW alarm output lights up the diode.
| Note | |
|---|---|
Connect the diode only as depicted, otherwise, it could be destroyed. |
In the following example, the Alarm output will be triggered whenever the temperature is out of its threshold range. In the real environment, any watched value can be used to trigger the Alarm output and control any attached device.
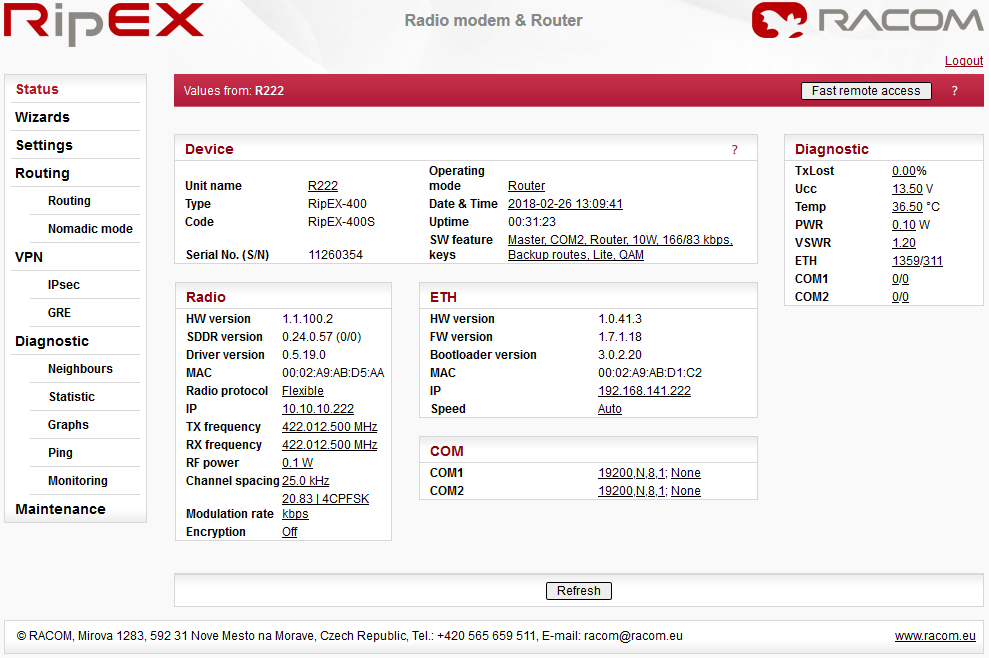
The current temperature can be displayed in the Status menu. Check the value shown in the picture below; the temperature of 36.5 °C is not highlighted and so it’s OK.
You can now test the Alarm output functionality by editing the Alarm management. By default, the temperature threshold range falls into the interval from -25 to +85 °C. You can manually edit these values so that the current temperature would be almost out of its allowed interval.
Go to the Settings menu and click on the Alarm management button.
RipEX does not control the diode by default. You need to set the following parameters:
Threshold to “Manual” (if you do not want to use the default threshold range)
HW Alarm Output to “N.O. (Normally opened)“
Temperature threshold (for testing, set the upper limit very close to the current temperature, e.g. in our example we have the currrent temperature 36.5 °C so the upper limit is set to 37 °C)
HW Alarm Output checked
Whenever the temperature is out of its threshold range, the red diode is turned on until the temperature falls back into the allowed interval.
To increase the temperature, you can for example:
close the demo case cover
ping other RipEX units (Diagnostic → Ping)
turn on the Monitoring (Diagnostic → Monitoring)
For the testing purposes, we can turn on the detailed graphs functionality. Go to the Settings → Device → Graphs menu and set the “Detail graph start” option to “Continual”. Apply the changes. With this feature on, you can check the temperature graph in one minute intervals.
Check the temperature in the Status menu. The value should be highlighted as in the below picture.
In our example, the upper limit was set to 37 °C. In the detailed graph below, you can see the temperature to be increasing from a value just below 36 °C to a maximum value over 41 °C. The alarm was triggered at the level of 37 °C (see the red line on the bottom) and the red diode was turned on. The second line represents the number of transmitted packets which was the main reason for the temperature increase. Immediatelly after stopping the traffic, the temperature started to decrease again.
The picture also contains a small fragment of the Overview graph.
This example just shows the basic usage of the alarm output. You can attach whatever device you need and control the alarm via any watched values.
RipEX web interface is equipped with comprehensive and detailed statistics and graphs. One could say, there is an embedded NMS (Network Management System) within RipEX.
Every RipEX can broadcast its Watched values to other reachable RipEX units within the network. Among these Watched values are: current supply voltage, internal temperature, RF output power, Voltage Standing Wave Ratio on the antenna feed line, packet counters on separate interfaces and other values.
These Watched values are displayed in the Diagnostic → Neighbours menu. See the following example with two neighbouring units.
The Diagnostic → Statistic menu provides you with information about data volume on all interfaces: Radio, Ethernet, COM1 and COM2. The menu displays the number of received and transmitted packets, their sizes and current throughput. Moreover, a detailed division into user and service packets is available for the radio channel.
The quick value descriptions are displayed in the balloon tips (place the cursor on any column header). The detailed description can be read in the respective Help.
Neighbours and Statistic values can also be displayed as graphs in the Diagnostic → Graphs menu. Each graph is available in a summary or detailed version and can display two different elements at once. Detailed graphs can be created continuously or can be triggered whenever monitored values are out of their threshold ranges. Each graph can be created based on the values of the unit itself or any other neighbouring unit.
The detailed graphs description can be read in the respective Help.
Monitoring is an advanced on-line diagnostic tool, which enables detailed communication analysis over any RipEX interface. In addition to all physical interfaces (Radio, Ethernet, COM1 and COM2), several internal interfaces between software modules can be monitored.
Go to the Diagnostic → Monitoring menu and just click on the Start button. In the default settings, it will display packet timing and payload on the Radio channel. For example, you can test Monitoring while performing the Ping test (Chapter Section 3.7.1, “RipEX-to-RipEX Ping”).
| Note | |
|---|---|
In order to see both on-line reports (Ping as well as Monitoring), start Ping in a new independent window or tab in your browser. |
The Demo case is an ideal tool for conducting laboratory tests and benchmarks, which shows you how the particular application will behave with cooperation with RipEX radio modems.
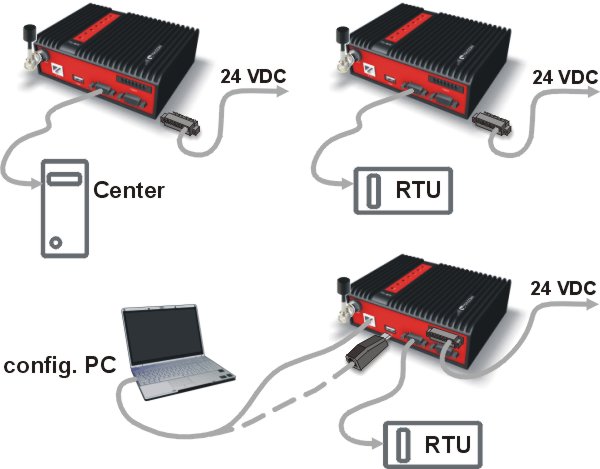
Connecting RTUs and central SW
Bridge mode
Configure the RipEX units in the Wizard menu.
Bridge mode with a repeater
Configure the RipEX units in the Wizard menu. Set the RipEX B as a repeater. You can check the features described in the RipEX manual, Chapter Bridge Mode: https://www.racom.eu/eng/products/m/ripex/ripex-detail.html#bridge_mode
For example, you can check that although the packet is received twice (directly and over the repeater), it is transmitted only once to the RTU.
Router mode (with repeater)
This mode is suitable for more complex networks and “Report by exception” applications. Its configuration is not straighforward and the Wizard is currently disabled.
Please refer to the manual for configuration examples, Chapter Router mode: https://www.racom.eu/eng/products/m/ripex/ripex-detail.html#router_mode
We support drivers for various SCADA protocols in the Router mode: Async Link, C24, Cactus, Comli, DF1, DNP3, IEC101, ITT Flygt, Modbus, Profibus, RP570 or UNI.
Alarm Management, SNMP
You can test RipEX SNMP (reading various values like Temperature, RSS, Serial number with snmpget or snmpwalk commands).
You can also test how your Network Management System cooperates with RipEX units.
For more details, see the Application Note, Chapter 2, RipEX SNMP Configuration Guide: https://www.racom.eu/eng/products/m/ripex/app/snmp.html.
Troubleshooting
RipEX has sophisticated monitoring features (see Chapter Section 3.8, “RipEX Diagnostic”) which make troubleshooting straightforward.
You can save the monitored traffic into the pcap format and examine it in the Wireshark or tcpdump program.
We have described several troubleshooting issues in the manual, Chapter Troubleshooting: https://www.racom.eu/eng/products/m/ripex/trouble.html.
And many others…
Within the RipEX Demo case, there is also one M!DGE 3G SCADA router so you can understand all M!DGE features and functionalities too. A few clicks will give you an easy summary about the product faster than reading many pages of text. Before any configuration changes, we recommend inserting a SIM card and connecting to the mobile network.
Before starting work with the HW please be sure that you have a SIM card enabled for data and you have all the necessary information from the mobile operator (PIN, APN, login, password).
Insert a SIM card into the SIM socket. Make sure the SIM is suitable for data transmission.
There are two reasons for installing the SIM card as the first task:
The SIM card may be damaged if inserted into a powered-up unit.
SIM card information is read only after power-up.
Connect one M!DGE Ethernet port to your computer using an ETH cat.5 cable.
If not yet enabled, please enable the Dynamic Host Configuration Protocol (DHCP) so that your computer can lease an IP address from M!DGE. Wait a moment until your PC has received the parameters (IP address, subnet mask, default gateway, DNS server). E.g. using Windows XP:
Start > Connect To > Show all connections > Local Area Connection > Right Click > Properties > Internet Protocol (TCP/IP) > Properties > Obtain an IP address automatically.
Alternative: Instead of using the DHCP, configure a static IP address on your PC (e.g. 192.168.1.10, mask 255.255.255.0) so that it is operating in the same subnet as the M!DGE.
The PC settings are very similar to the description in Chapter Section 3.4, “Programming RipEX via Computer”.
The factory defaults (with DHCP enabled):
IP address – 192.168.1.1 (ETH1), 192.168.2.1 (ETH2)
Subnet mask – 255.255.255.0
Start a Web Browser on your PC. Type the IP address into the address line: http://192.168.1.1.
Please set a password for the admin user account. Choose something that is both easy to remember and a strong password (such as one that contains numbers, letters and punctuation). The password must have a minimum length of 6 characters. It must contain a minimum of 2 numbers and 2 letters.
The Web Manager can always be reached via the Ethernet interface. After the successful setup, Web Manager can also be accessed via the mobile interface.
Before you begin any operation in the mobile network, at least the following steps have to be performed:
Defining the admin password (already done in Chapter Section 3.11.2, “Programming M!DGE via Computer”).
Entering the PIN code for the SIM card if required.
Configuring the Access Point Name (APN).
Starting the mobile connection.
Please see the M!DGE manual for configuration details: https://www.racom.eu/eng/products/m/midge1/index.html
Since the best way to understand the product is through practice, we have described a few practical tests you may wish to conduct.
If you have a SIM card inserted and you are logged into the M!DGE unit, we can proceed with a basic Mobile configuration steps.
Go to the menu and click on the button.
In the following screen, fill in the correct PIN code, other parameters can be left at their defaults. After applying the changes, you should see a similar screen with SIM state set to ready.
The next step is to click on the Network submenu to check whether we are successfully registered into the mobile network.
Now go to the Interfaces menu in the left section (Mobile menu) and click on the Add button.
Fill in all appropriate values. You should get these values from your mobile operator.
The router should be connecting to the network now. Check whether the mobile connection is enabled in the menu. You should have a WWAN1 interface selected as permanently connected.
In the HOME menu, you should now see that the Operational Status is up and so the router is connected to the Mobile network. Click on the WWAN1 submenu to see the details like IP address, Signal strength, Service type and other parameters.
If you are connected to the APN which can reach Internet IP addresses, you can check the connectivity by sending ping packets to any desired IP address.
| Note | |
|---|---|
If you cannot access Internet IP addresses, you should be able to access other IP addresses. It depends on the SIM and APN settings. |
Go to the menu. Fill in the Host IP address and other parameters and click on the button.
If the IP address is accessible, you should see an output like:
| Note | |
|---|---|
Once you can access public Internet IP addresses, you can also run your Web browser and fill in e.g. www.racom.eu to see our website. |
In this test, we will demonstrate the interconnectivity of M!DGE and RipEX units. You need to have at least two RipEX units (e.g. RipEX A, B) configured as described in Chapter Section 3.6, “RipEX Wizard Configuration”.
You can have M!DGE in the default state (just after successful login procedure). Connect your PC to the M!DGE ETH2 interface and set the PC to obtain the IP address by DHCP.
The M!DGE unit should provide the PC with an IP address from
the 192.168.2.0/24 range,
e.g. 192.168.2.108.
| Note | |
|---|---|
See Chapter Section 3.7, “RipEX Practical Tests” to know how to configure your PC and execute a ping command. |
Open your web browser and type in the M!DGE IP address (http://192.168.2.1). After successful login, go to the menu.
Fill in the RipEX B IP address (192.168.1.102) and click on the Start button. You should see successful ping attempts between the M!DGE unit and the remote RipEX unit. The ping packets are transmitted over the Ethernet cable to the local RipEX and via the radio link to the remote RipEX and back again.
M!DGE offers you several ways to debug and troubleshoot configuration issues.
The Network Debugging menu consists of well known tools: ping, traceroute and tcpdump. We have already described ping. Traceroute can provide you with a packet route to the destination and with tcpdump you can capture the incoming and outgoing traffic on any interface. When the capturing is done, you can open the saved PCAP file in Wireshark or a similar program.
Another tool is darkstat, which creates graphs based on the traffic volume on any interface.
To run the darkstat tool, just click on the darkstat submenu, choose the interface and click on the Start button.
We can see for how long the tool is running, how many packets/bytes have been stored and four graphs with different intervals. See the following example.
The log files can be viewed, downloaded and reset in this menu. Please study them carefully in case of any issues.
In the Tech Support menu, you can generate and download a tech support file, which you should send to our support team to speed up resolving the issue.
The Demo case is an ideal tool for conducting laboratory tests and benchmarks, which shows you how the particular application will behave in cooperation with M!DGE 3G SCADA router.
VPN Tunnels
M!DGE provides three types of tunneling – OpenVPN, IPsec and PPTP. Each of them is configurable via the web interface.
With VPN tunnels, you can access M!DGE or connect various networks in a secure way.
For more details, see the M!DGE manual:
https://www.racom.eu/eng/products/m/midge1/web_conf.html#VPN
Connection Supervision
Connection Supervision is used for switching between several connections if available. In addition it is possible to set an emergency action in case that no connection is available for a specified length of time.
For more details, see the M!DGE manual:
https://www.racom.eu/eng/products/m/midge1/web_conf.html#interfaces
SNMP
M!DGE is equipped with an SNMP daemon, supporting basic MIB tables (such as ifTable), plus additional enterprise MIBs to manage multiple systems.
You can also test how your Network Management System cooperates with M!DGE units.
For more details, see the M!DGE manual:
https://www.racom.eu/eng/products/m/midge1/web_conf.html#services
Software Development Kit (SDK)
RACOM 3G routers ship with a Software Development Kit (SDK) which offers a simple and fast way to implement customer-specific functions and applications.
For example, you can control your M!DGE router with SMS messages – rebooting, reading connection status or digital outputs, …
For more details, see the M!DGE manual:
https://www.racom.eu/eng/products/m/midge1/web_conf.html#services
SCADA application and M!DGE
M!DGE is ready for SCADA applications even with serial SCADA protocols on the RS232 interface.
For more details, see the Application note:
https://www.racom.eu/eng/products/m/midge/app/index.htmlThe Application notes consist of various examples of static/dynamic addressing, various network centre designs, Hybrid 3G/Radio networks etc.
And many others…
We have described just a few examples of Demo case usage. Feel free to download the “RipEX User manual” from https://www.racom.eu or the “RipEX Application notes” from https://www.racom.eu to conduct further tests.
With your M!DGE 3G router, you can easily extend the RipEX UHF/VHF network. Download the “M!DGE Operating manual” from https://www.racom.eu or the “M!DGE Application notes” from https://www.racom.eu for more details.
Do not hesitate to contact us if you have any questions:
RACOM technical support
team
E-mail:
<support@racom.eu>
Tel.:
+420 565 659 511