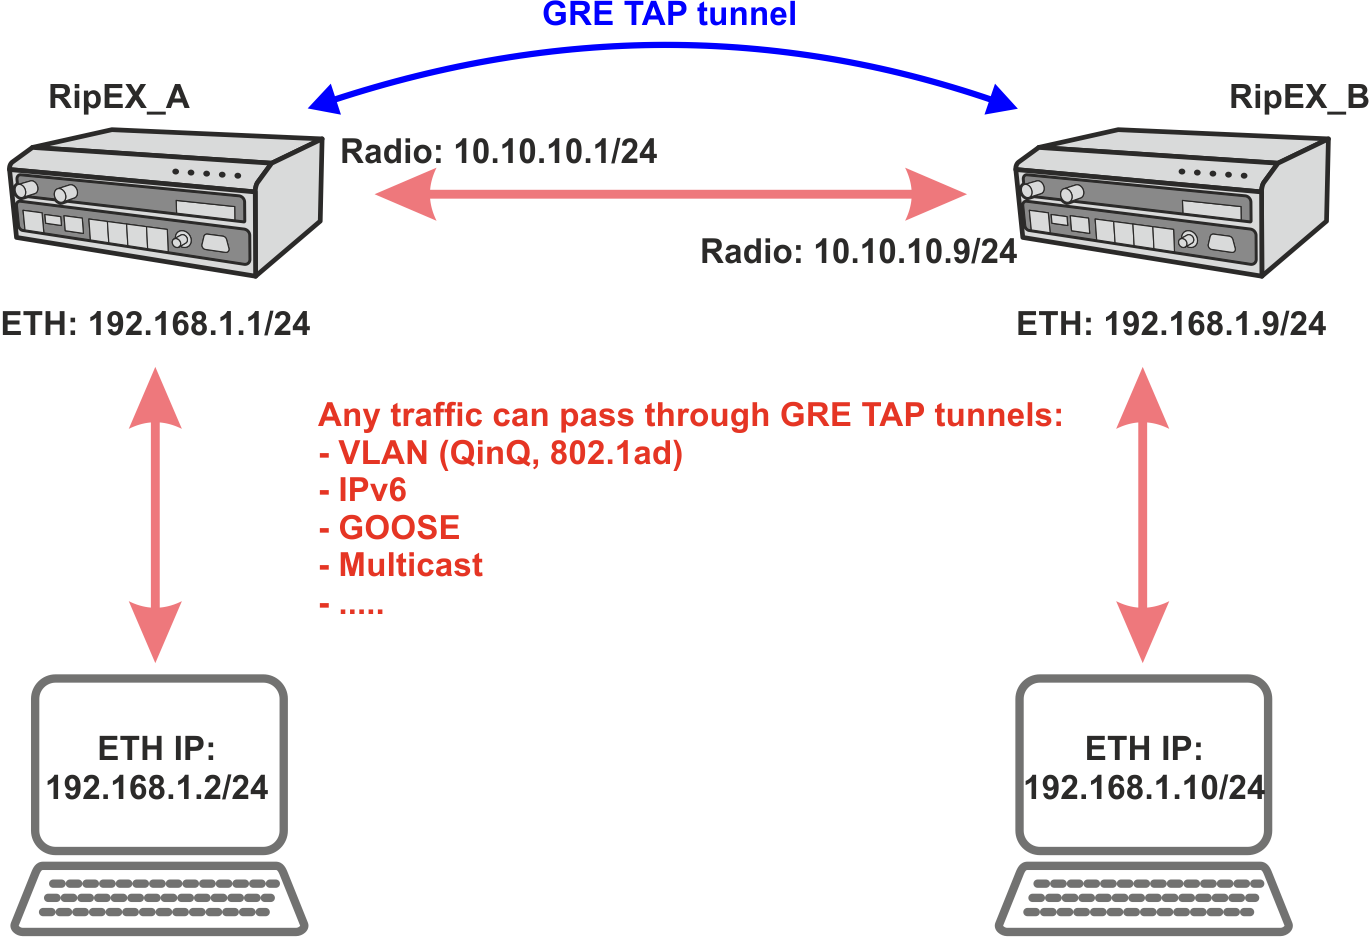
GRE L2 tunnel captures Ethernet frames of the bridge and sends them to the other end of the tunnel. It is linked up to the RipEX2 internal bridge (LAN interface) as one of the bridge’s ports. It enables to build bridges via the complex routed infrastructured networks and combines the local partial segments into one network segment.
We had a so-called ARP proxy functionality in RipEX radios. Proxy ARP is a technique by which a proxy server (local RipEX) at given network answers via the Address Resolution Protocol (ARP) queries for an IP address that is not on that local network segment. This functionality is not implemented in RipEX2, but with the GRE TAP tunnelling feature, advanced native full transparent Layer2 (Ethernet) connectivity over the Layer3 Radio network can be achieved.
GRE L2 tunnel can be used to natively transport IPv6 traffic, GOOSE messaging, multicast, VLAN double-tagged packets – QinQ 802.1ad or single tagged 802.1q over the RipEX2 IPv4 network.
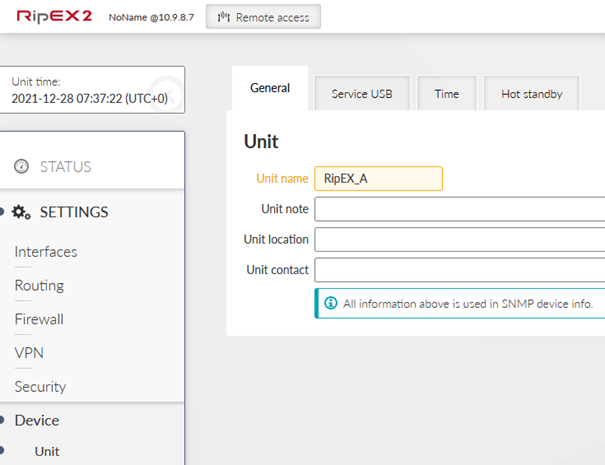
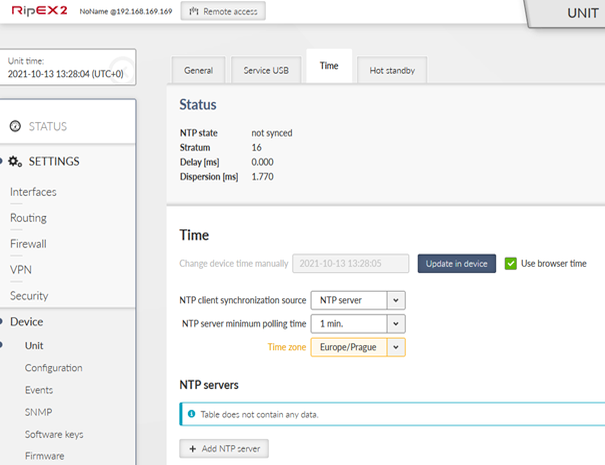
Start with RipEX2 units in factory settings. From this point, do the following changes. Go to the Device – Unit menu and set the Unit name. You can also update time in the device so that debugging is easier afterwards (time synchronization).
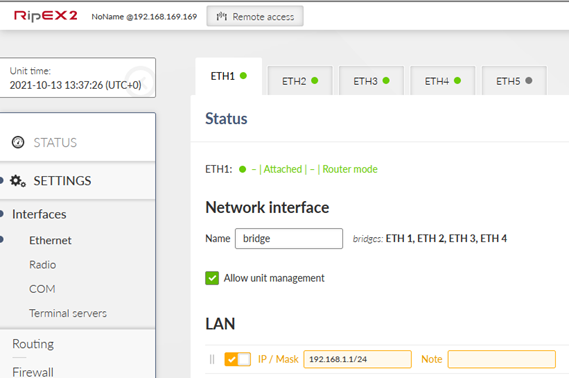
Go to the SETTINGS – Interfaces – Ethernet and set the 192.168.1.1/24 IP address.
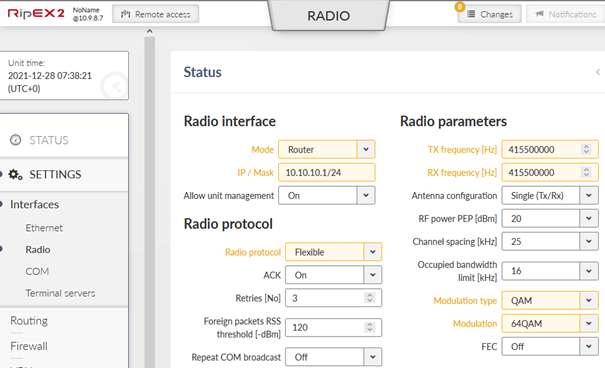
Change the Radio interface configuration.
| Router |
| Flexible (can be BDP as well) |
| 10.10.10.1/24 |
| Set to any value appropriate to you |
| QAM (you can use FSK as well, but set the same in RipEX_B) |
| 64QAM (choose to suit your needs) |
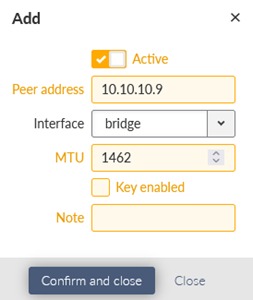
Go to the VPN – GRE menu and set the L2 GRE TAP tunnel. The only parameter is the Peer address equal to 10.10.10.9 (RipEX_B radio IP).
Save all the changes and do similar steps in RipEX_B.
RipEX_B configuration is the same as in RipEX_A so you can upload the saved configuration from RipEX_A to RipEX_B and then change the following parameters:
| RipEX_B |
| 192.168.1.9/24 |
| 10.10.10.9/24 |
| 10.10.10.1 |
The most basic example is to run ICMP ping from RipEX2 GUI, or you can run an ICMP from connected devices as well.
Go to the RipEX_A or RipEX_B Diagnostics – Tools menu and select ICMP ping tab. Fill in the Destination IP. In this example, local accessed unit is RipEX_B and ping is run against 192.168.1.1 IP address.
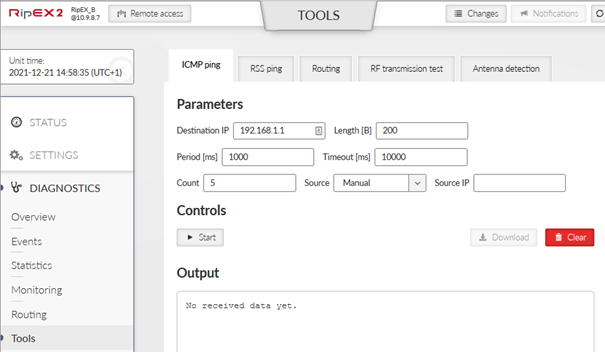
Click on the Start button and you should see a similar output.
PING 192.168.1.1 (192.168.1.1) from 192.168.1.9 : 200(228) bytes of data.
208 bytes from 192.168.1.1: icmp_seq=1 ttl=64 time=110 ms
208 bytes from 192.168.1.1: icmp_seq=2 ttl=64 time=82.2 ms
208 bytes from 192.168.1.1: icmp_seq=3 ttl=64 time=119 ms
208 bytes from 192.168.1.1: icmp_seq=4 ttl=64 time=101 ms
208 bytes from 192.168.1.1: icmp_seq=5 ttl=64 time=119 ms
— 192.168.1.1 ping statistics —
5 packets transmitted, 5 received, 0% packet loss, time 4005ms
rtt min/avg/max/mdev = 82.299/106.792/119.951/14.101 ms
In a Diagnostics – Monitoring menu, you can verify that packets are encapsulated to GRE. Enable Radio interface monitoring for all on the Radio channel. You can set the Length parameter to 0 Bytes so that more lines fit into one console output.
You should see similar GRE traffic in your output (you can run another ICMP ping from a 2nd window).
14:55:59.565152 [RF:phy:tx] IP 10.10.10.9 > 10.10.10.1 GRE, length:284
14:55:59.619935 [RF:phy:rx] IP 10.10.10.1 > 10.10.10.9 GRE, length:284, rss:74 mse:36
14:56:04.624331 [RF:phy:tx] IP 10.10.10.9 > 10.10.10.1 GRE, length:84
14:56:04.877228 [RF:phy:rx] IP 10.10.10.1 > 10.10.10.9 GRE, length:84, rss:74 mse:36
14:56:04.913019 [RF:phy:tx] IP 10.10.10.9 > 10.10.10.1 GRE, length:83
14:56:04.977027 [RF:phy:rx] IP 10.10.10.1 > 10.10.10.9 GRE, length:83, rss:74 mse:37
Once all of this is working fine, you can test traffic which is most important for you – such as
VLAN double-tagged packets
IPv6
Multicast
GOOSE
…
Every single packet is now being transferred over the Radio channel which has a limited bandwidth. Very often, you may need to limit forwarded traffic – e.g. allowing multicast and ARPs, but disabling IPv6.
Since the 2.1.6.0 firmware, you can configure the L2 forward firewall so it e.g. denies all the multicast data, IPv6 etc.
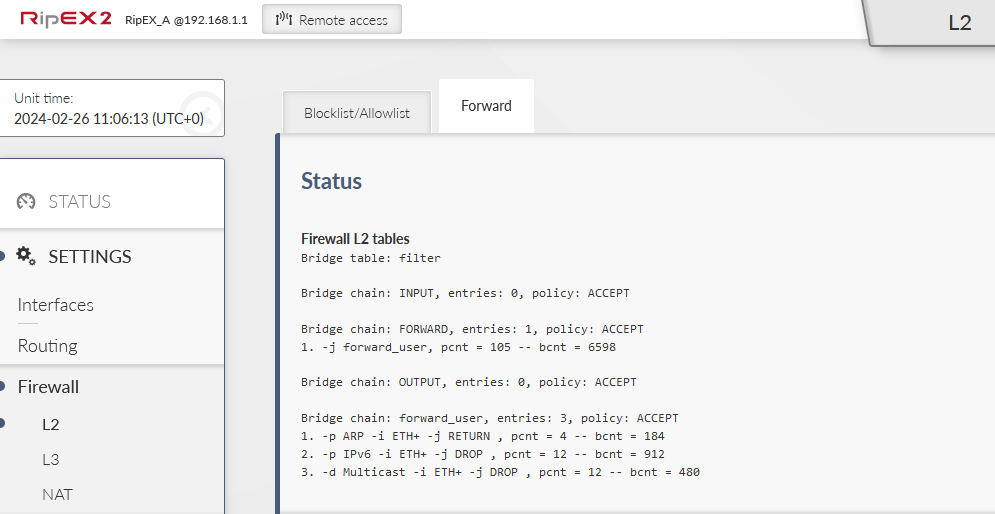
Within this example, L2 Forward firewall will block the traffic coming to the RipEX2 via any of its ETH ports and being forwarded to ‘any’ interface (especially the ‘radio’ interface). The denied traffic is going to be IPv6 and multicast. ARP data are also multicast packets, for a proper L2 functionality, the 1st rule enables ARP data.
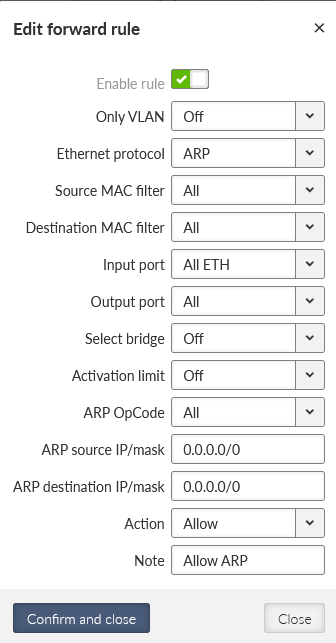
Go to the SETTINGS > Firewall > L2 > Forward menu. Add the 1st rule enabling ARP data.
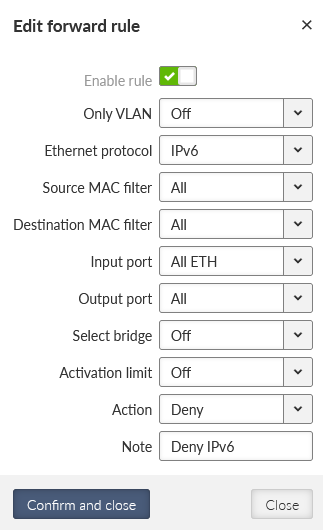
Add two other rules. Deny IPv6 data:
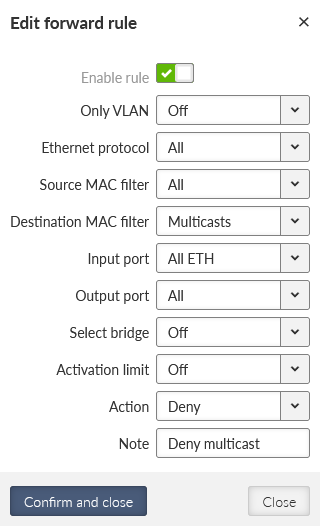
Deny Multicast data:
Send the changes to the unit and do the same in 2nd unit. Open the L2 firewall status and keep it being refreshed. Try some PING data being sent (allowed ARP packets). Try to do some Internet access from your laptop via the default gateway set to our RipEX2 Ethernet Network Interface. You should see the counters being increased.