In order to evaluate the quality of the radio link, different characteristics are used in practice. Data quality (DQ), error vector magnitude (EVM), modulation error (MER) or mean square error (MSE) or signal-to-noise ratio (SNR) are most often. In the following, there is a brief description of what they mean in RipEX devices.
Data quality DQ – historically, the radio devices used single modulation format e.g. GMSK etc. In this case it was enough and very comfortable for the user to see the data quality indicator in relation to how “good” the radio data transfer is. It has been given for instance in percentage with natural meaning:
above 50%DQ the link is good
below that the link might experience data or frame loss and need care
With the introduction of more and different modulation formats there are more questions to answer. Is this radio link good enough for this modulation format? If the data quality of the link drops to a certain level, would that modulation format have problems? What are the link quality switching thresholds for the ACM (automatic coding and modulation)? To answer those questions, more general signal quality indicators are used.
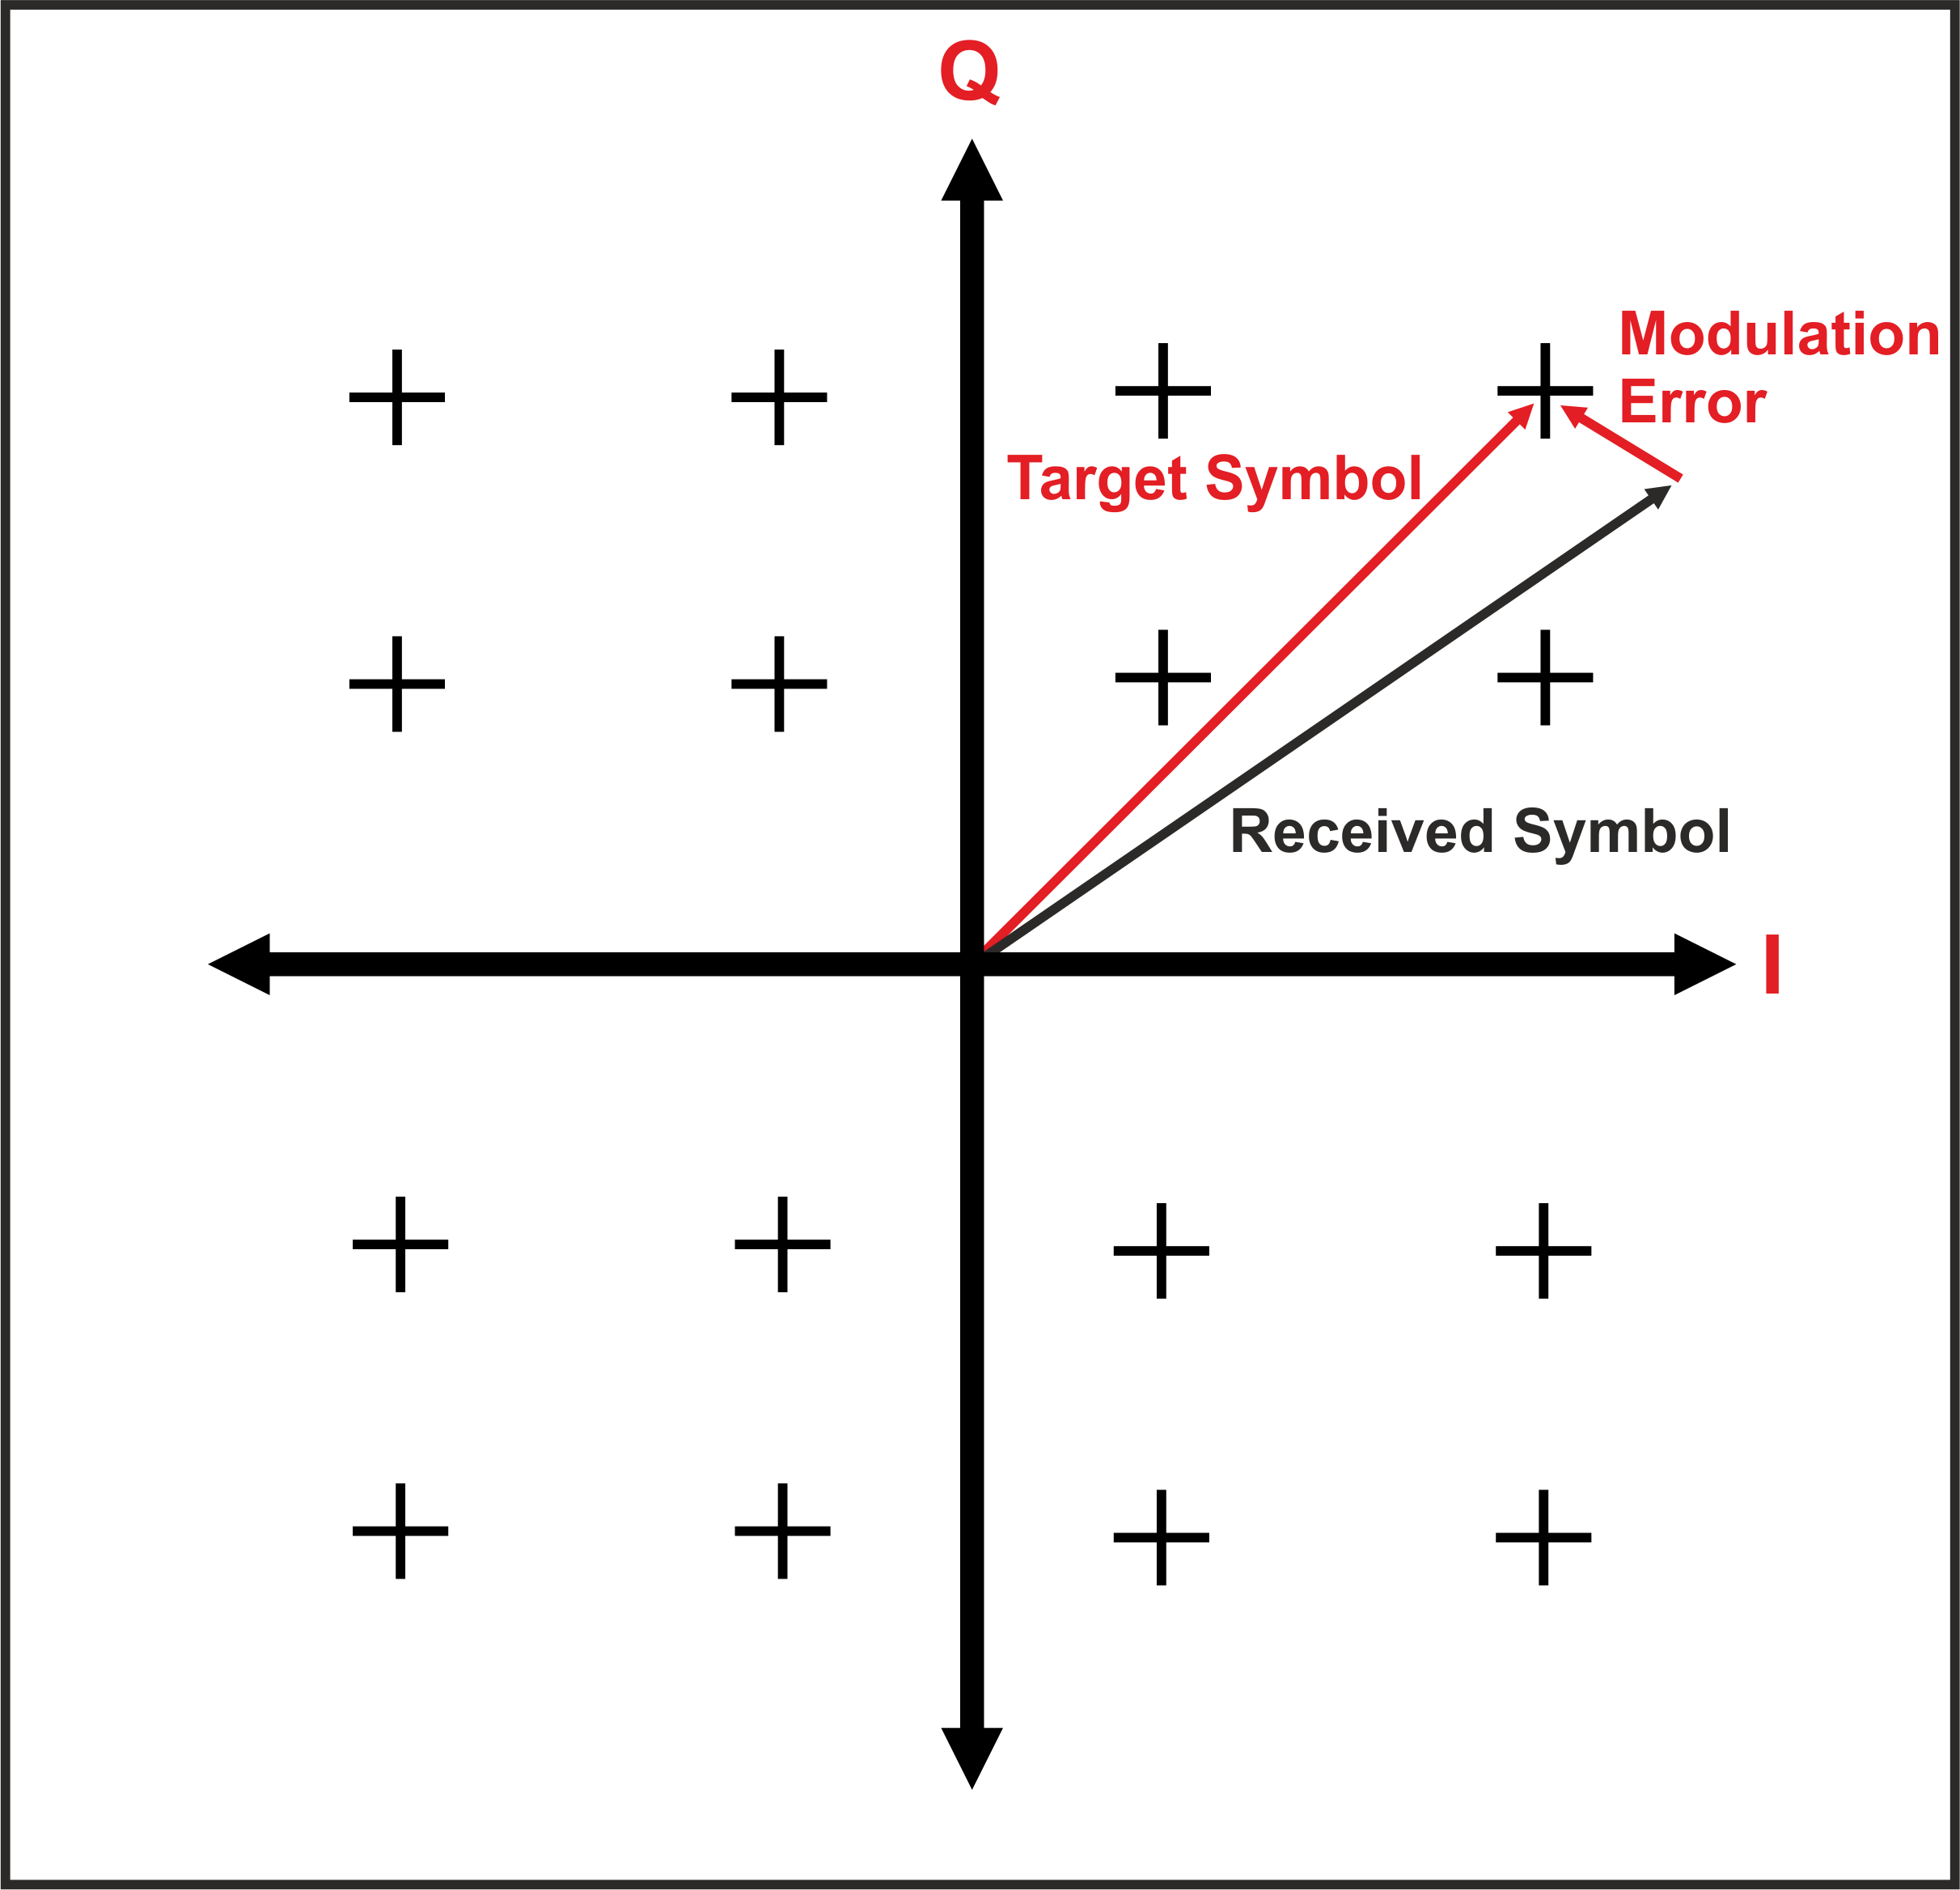
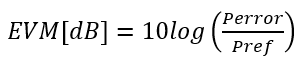
EVM and MER have essentially the same meaning and describes the modulation distortion being caused be all sources of signal distortion, radio channel, thermal and other noise sources etc. EVM is a measure of how far the actual signal points are from their ideal locations. It describes the actual distance from expected constellation point as shown in Figure 1. It can be given either in [%] or [dB] calculated by the formula:
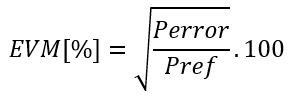
Can also be expressed as a percentage:
Mean Squared Error MSE
Different modulation constellation e.g. PI/4-DQPSK, 256QAM has different Pref so more general quality indicator in this case is just the error power or squared error normalized to the unity vector power.
Usually one radio frame or packet consists of several modulation symbols so instead of single squared error it is beneficial to calculate a mean value of the squared error – Mean Squared Error – MSE:

Please note that this is just a mean value of the individual modulation errors within a single packet. To qualify the links quality, it is even more useful to calculate the mean (arithmetic average) value of the packet MSE over larger number of packets e.g. 100 or 1000.
Also note that the MSE is bandwidth independent, so if the modulation format needs MSE of -25 dB or better for 25 kHz channel bandwidth it needs also -25 dB or better for 250 kHz. This should not to be confused with the RSS (receive signal strength) which in this example should be at least 10dB higher.
EVM, MSE versus SNR
EVM, MSE and SNR (signal to noise ratio) are closely related and instead of a sign they can be considered the same signal quality indicators.
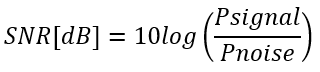
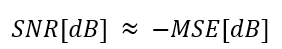
Usually, this is true for high EVMs, MSEs values e.g. -7 dB up to -30 dB where, in most cases, it indicates the distance between signal and noise or interference levels, while for low EVMs and MSEs below -30dB the value is mostly influenced by all sources of signal distortion rather than just thermal noise.
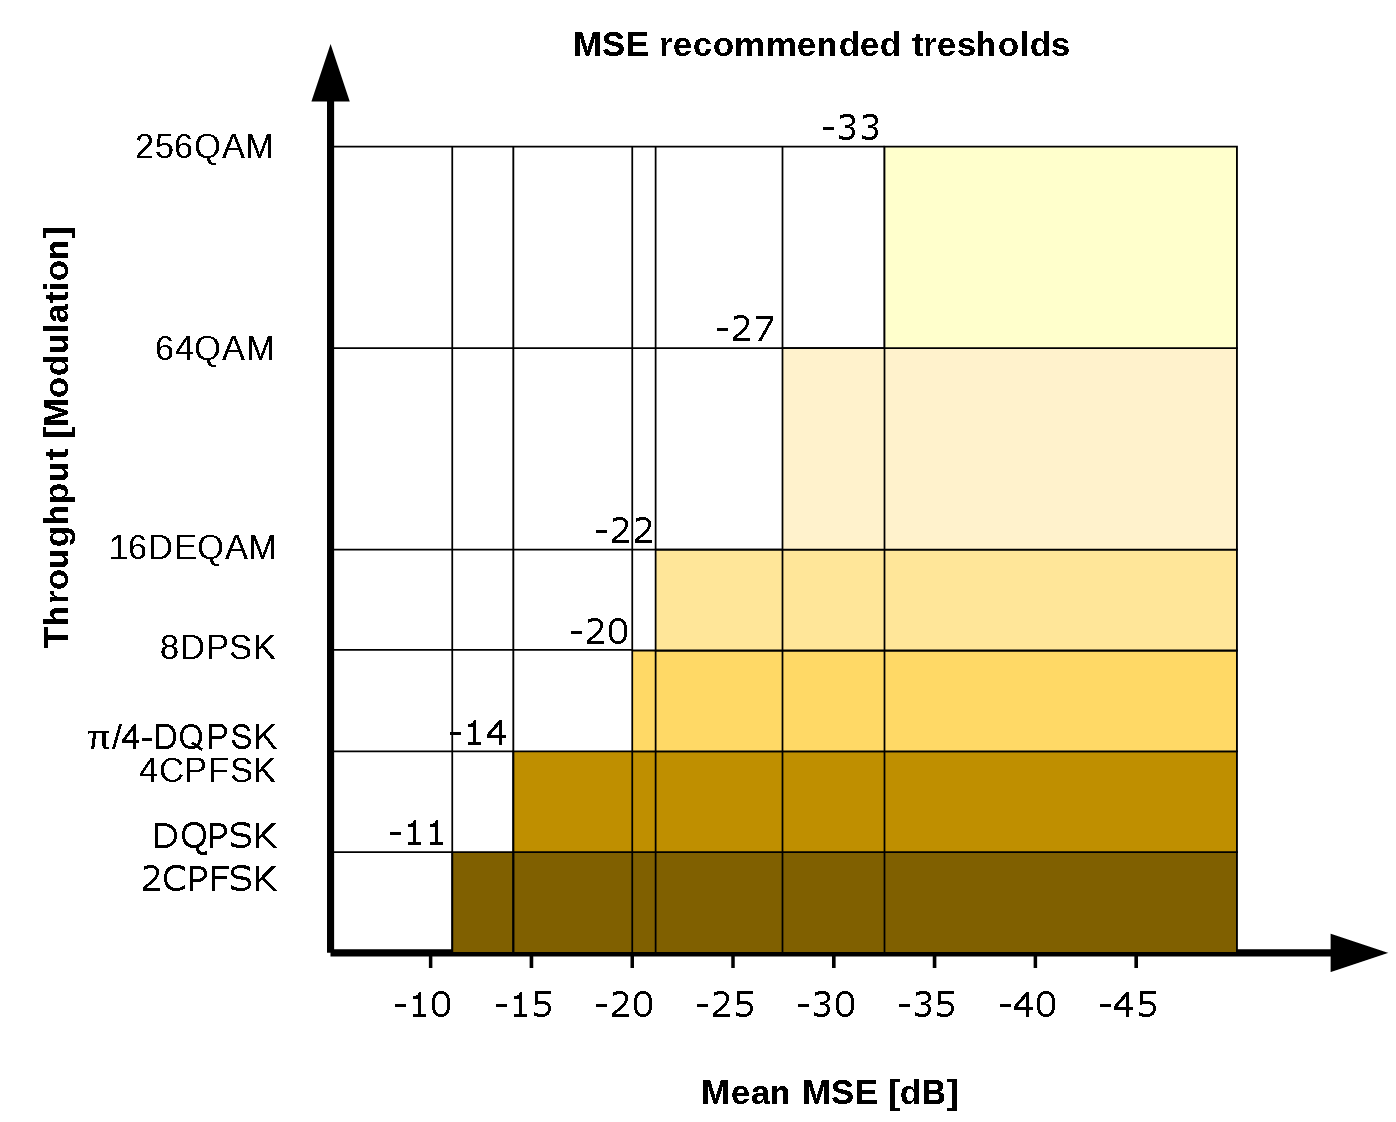
MSE thresholds for successful message transmission
In order to reach a successful packet transmission operation using the selected modulation and coding format, the average or mean MSE value should be lower (-30 dB is lower than -25 dB) than the recommended threshold shown in Table 1.
|
Recommended thresholds | |
|
Modulation FEC |
Mean MSE |
| [-] | [dB] |
| 256QAM, 1/1 | -33 |
| 256QAM, 3/4 | -30 |
| 64QAM, 1/1 | -27 |
| 64QAM, 3/4 | -24 |
| 16DEQAM, 1/1 | -22 |
| 16DEQAM, 3/4 | -19 |
| 8DPSK, 1/1 | -20 |
| 8DPSK, 3/4 | -17 |
| π/4DQPSK, 1/1 | -14 |
| π/4DQPSK, 3/4 | -12 |
| DPSK, 1/1 | -11 |
| DPSK, 3/4 | -10 |
| 4CPFSK, 1/1 | -15 |
| 4CPFSK, 3/4 | -12 |
| 2CPFSK, 1/1 | -11 |
| 2CPFSK, 3/4 | -10 |