1. Reliability of Data Transmission in the MORSE Radio Network:
There are basically 2 factors causing a relatively high radio channel error rate (typically BER 10-3 to 10-5):
- Low signal/noise ratioA relatively low signal-to-noise ratio causes a bit error rate, which is corrected for in MORSE system radio modems by a self-correcting code at the bit level.
On top of that the data part of the packet is protected by a 32-bit CRC.
Coding and checking is done separately on each connection and the packet is acknowledged or possibly repeated.
Acceptance of an erroneous packet is therefore practically eliminated. - Impulse InterferenceFor simplicity it is possible to include all randomly appearing receiving faults under this term (industrial interference, atmospheric interference, alien transmissions). The variability of the influence of this type of interference is generally significant because besides its actual changes there is also significant fluctuation in the level of the wanted signal.
2. Packet Loss Probability
In order not to lose packets on a relatively unreliable radio channel it is necessary to transmit packets securely, i.e. packets are sent again if no confirmation of packet delivery is received.
The maximum permitted number of repeats on individual lines has a significant effect on the resulting reliability of packet transmission through the network.
The probability of repeating packets (losses) is dependent on the instantaneous quality of signal propagation over the radio channel.
The MORSE network attains the following parameters on individual lines for 90 % of the time in practice:
| Propagation conditions | Probability of repeating (losses) |
|---|---|
| Normal | 1:100 (1%) |
| Impaired | 1:10 (10%) |
| Exceptionally bad | 1:2.5 (40%) |
The influence of specific values of repeating settings on the overall reliability of transmission is show in the following example:
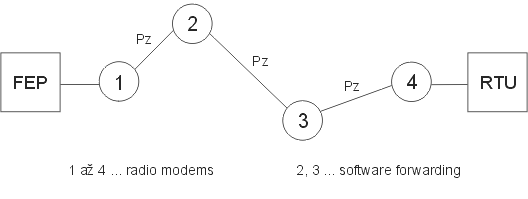
 The radio part between FEP and RTU requires 2 forwarding points. For successful delivery of the request and reply the packet must pass through 4x wire and 6x radio connections altogether.
Key:
Pz – probability of repeating ( = losses) a packet at one connection
Pc – probability of packet loss over the whole route
R – maximum permitted number of attempts at one connection (number of repeats + 1)
If we ignore the error rate on the wire connection the probability of packet loss on the whole route will be
Pc = 1 – (1 – PzR)6
If we calculate the probability of losing a packet over the whole route for various operating situations and maximum permitted numbers of repeats we obtain the following table:
| Operating situation (propagation conditions) |
Pz | Pc (for R=1) |
Pc (for R=4) |
Pc (for R=6) |
|---|---|---|---|---|
| Normal | 0.01 | 0.06 | 0.000 000 06 | 0.000 000 000 006 |
| Impaired | 0.1 | 0.47 | 0.000 6 | 0.000 006 |
| xceptionally bad | 0.4 | 0.953 | 0.144 | 0.024 |
The table shows that under impaired conditions _ 47 % probability of loss – operation is practically unusable in systems which don_t have repeats.
Permission of 3 repeats means a worsening of the reliability of transmission to 85.6% even for the worst case.
Upon permitting 5 repeats reliability goes up to 97.6% (Pc=0.024) even under the worst propagation conditions.
The number of repeats is adjustable in the MORSE network, with the typical setting being 5.
3. Response Time and its Dependence on Propagation Conditions:
Each repeat logically results in an extension of the response time.
For our example we shall calculate the average response time (along the radio route) for the same situation as in the previous example. We shall use the following numbers:
- length of request: 10 bytes
- length of response: 50 bytes
- extension due to one repeat: 0.45 sec
Besides average responses it is also important to know the probability of occurrence of extremely long response times. In order to calculate the spread of probabilities of a certain number of repeats on the radio route a special program was created.
| Operating situation (propagation conditions) |
Pz | Response (for R=1) |
Response (for R=4) |
Response (for R=6) |
|---|---|---|---|---|
| Normal | 0.01 | 0.6 | 0.627 | 0.627 |
| Impaired | 0.1 | 0.6 | 0.899 | 0.9 |
| Exceptionally bad | 0.4 | 0.6 | 1.898 | 2.291 |
| Max. theoretically possible response time [s] | 0.6 | 8.7 | 14.1 |
By comparing both tables it is possible to deduce that if the reliability of transmission is close to 100% the average response time does not depend on the number of repeats.
This fact can also be deduced by a simple logical consideration – shortening of the response by reducing the permitted number of repeats is only possible at the price that the packets start getting lost. In other words packets with a potentially longer response will not be delivered at all.