To access our SNMP values, any Network Management System (NMS) can be used. However, we recommend using the ZABBIX open source monitoring system. It can be downloaded at http://www.zabbix.com/download.php.
Zabbix features are explained here – https://www.zabbix.com/features.
If you have chosen the Zabbix software, please read the following pages where we offer a basic Starting Guide to RipEX2 and Zabbix co-working.
Whatever your choice of NMS, these sections may provide general hints and tips anyway.
| Note | |
|---|---|
The following guide was tested with Zabbix LTS version 6.0. There is no RipEX2 application note for older Zabbix releases. |
Take the opportunity to remotely access and test a live Zabbix demo. See the credentials within the text on the given link.
Follow the Zabbix documentation at: https://www.zabbix.com/documentation/current/en/manual, download packages from https://www.zabbix.com/download and install Zabbix 6.0 LTS. We suggest using Debian11 (or newer) OS, MySQL database and Apache web server, because of our good experience and knowledge. If using different solution, our help can be limited.
| Note | |
|---|---|
With previous Zabbix versions, we suggested using CentOS7 and CentOS8, but due to changes in distributing these operating systems, Debian OS seems to be much more appropriate. |
Zabbix also offers paid support – see all the possible support tiers at https://www.zabbix.com/support.
Once Zabbix 6.0 LTS is installed, multiple additional installation steps are required so that you can monitor and maintain your RipEX2 (and any other RACOM products) network(s). Required steps are explained later within this application note.
We also offer Zabbix 6.0 LTS as a virtual, ready-to-be-used, image. It is called “RACOM Zabbix Appliance” or in short “RZA6”. Within this .ova image, functionality for all RACOM products is already installed and ready to be used. Contact our support to obtain this virtual machine and stay in touch with us for more details.
You can run this RZA6 as a virtual machine, e.g., within your VMware or VirtualBox environment (or any similar one).
Once you finish basic Zabbix 6.0 LTS installation following the Zabbix documentation, you can and should check this part for more details about required steps for RACOM products Zabbix support. The order of explained steps is not so important usually.
| Note | |
|---|---|
If there is any particular Linux command, it is based on Debian11 OS. |
We suggest various applications for future usage:
traceroute
nmap
zabbix-sender
sshpas
All the commands can be installed from the command line with:
# apt-get install traceroute nmap zabbix-sender sshpass
If you need, you can implement sending PDF reports
automatically. The installation and functionality can vary from version to version so we
do not describe step-by-step procedure here. Use Zabbix documentation for more
details.
https://www.zabbix.com/documentation/current/en/manual/appendix/install/web_service
For RACOM products, multiple steps are required. Upload all the MIBs from respective devices (RipEX2 in our case) to /usr/share/snmp/mibs/ directory. For a proper functionality, add them to SNMP configuration file /etc/snmp/snmp.conf. E.g.:
mibs +/usr/share/snmp/mibs/MG-MIB.txt
mibs +/usr/share/snmp/mibs/RacomRay3.mib
mibs +/usr/share/snmp/mibs/RacomRay2.mib
mibs +/usr/share/snmp/mibs/RACOM-RipEX-1.0.4.0.mib
mibs +/usr/share/snmp/mibs/SNMPv2-TC.txt
mibs +/usr/share/snmp/mibs/RACOM-RA2-MIB
Templates
Download RipEX2 Zabbix 6.0 template from our website. Unzip the file and import zbx_export_ripex2.yaml into your Zabbix instance in Configuration -> Templates menu via web interface. The template consists of:
approximately 300 Item values (10 tags) which can be read from RipEX2 units (proprietary OIDs only – i.e., OID starting with 1.3.6.1.4.1.33555.3 prefix). For other general OIDs, use Zabbix predefined templates or do your own templates (e.g., SNMPv2-MIB::sysDescr.0, SNMPv2-MIB::sysName.0, …)
Most of the values are for Events and Traps
Discovery rules
For the 2.0.10.0 firmware, there are 9 Discovery rules
We use Discovery rules for RipEX2 statistics, because most statistics consist of individual lines within tables where each line is e.g., another RipEX2 unit, Ethernet port or SIM card – and because these tables can change based on configuration, HW capabilities and network diagram/topology, individual items must be discovered first.
Once discovered, new Items are automatically created and then, Zabbix handles them as basic Items. The only difference is that if a particular new Item becomes unsupported, Zabbix deletes it automatically after a predefined time.
Default Template settings:
All Items are in Disabled state
Most values are being updated once a day
All Discovery rules are disabled as well
Most values are being updated every 15 minutes
By default, each discovery rule is run every 8 hours – If you have a static network, it might be enough to run it once and disable the rules afterwards
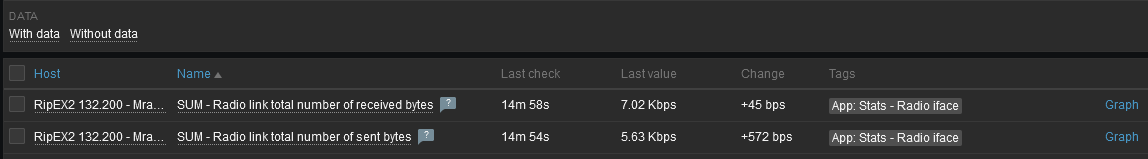
Two calculated items were also predefined – they both sum all received/sent bytes for all neighbouring RipEX2 units (in GUI the values are displayed in Radio Protocol statistics table in “Total [B]” column). These values can be useful to show approximate value of data being transferred over the Radio channel, incl. control frames. Both can be found with a tag “Stats – Radio iface” or check the items with “SUM” key word.
Other important steps are for SNMP traps. Once the trap is received, it is handled by our script and for its proper functionality, the OID cannot be translated to text. Edit the snmptrapd:
# systemctl edit snmptrapd.service --force –full
Change the ExecStart variable:
ExecStart=/usr/sbin/snmptrapd -Lsd -f -p /run/snmptrapd.pid -On
The whole file should be:
# cat /etc/systemd/system/snmptrapd.service
[Unit]
Description=Simple Network Management Protocol (SNMP) Trap Daemon.
After=network.target
ConditionPathExists=/etc/snmp/snmptrapd.conf
[Service]
Type=simple
ExecStart=/usr/sbin/snmptrapd -Lsd -f -p /run/snmptrapd.pid -On
ExecReload=/bin/kill -HUP $MAINPID
[Install]
For a proper functionality of RipEX2 SNMP notifications, multiple additional steps are required. The following sections focuses on SNMPv2c traps and informs. The SNMPv3 notifications are described later on. Also keep in mind that you could configure RipEX2 notifications different way (e.g., via SNMPTT) – here is just one approach described.
If not yet installed, install ‘snmptrapd’ daemon and enable it to be run automatically.
Within the downloaded .zip templates from our website, snmptrap.sh script is included. Copy the script into /usr/lib/zabbix/externalscripts/ directory and change the file privileges and make it executable.
# chown zabbix:zabbix /usr/lib/zabbix/externalscripts/snmptrap.sh
# chmod +x /usr/lib/zabbix/externalscripts/snmptrap.sh
| Note | |
|---|---|
Your ‘zabbix’ user should be enabled. It should have a HOME directory set to /var/lib/zabbix/ and this user should be able to run the shell. E.g., this command can be helpful: |
# usermod --shell /bin/bash zabbix
Check your ‘zabbix_sender’ path and if required, change it within the provided snmptrap.sh script accordingly.
# which zabbix_sender
/usr/bin/zabbix_sender
So, the script has this line inside:
ZABBIX_SENDER="/usr/bin/zabbix_sender";
The script parses the output of each received SNMP trap, selects the appropriate host and declares an associative array containing trap descriptions. Eventually, it sends the whole message to your Zabbix server.
The default path to a LOG file from snmptrap.sh script is /var/log/snmptrap/snmptrap.log. Create the directory and a file manually, if not yet created.
Another required step from the command line is to edit /etc/zabbix/zabbix_server.conf file. Find the appropriate lines and edit them to:
SNMPTrapperFile=/var/log/snmptrap/snmptrap_snmptt.log
StartSNMPTrapper=1
| Note | |
|---|---|
It is possible to configure log rotating. To do so, add two files into /etc/logrotate.d directory called “zabbix-snmp-trap” and “zabbix-snmp-trapper”. The format of both the files is the same, excluding the file path: /var/log/snmptrap/snmptrap.log {
weekly
rotate 12
compress
delaycompress
missingok
notifempty
create 0640 root root
}and /var/log/snmptrap/snmptrap_snmptt.log {
weekly
rotate 12
compress
delaycompress
missingok
notifempty
create 0640 root root
} |
Zabbix, and especially your snmptrapd must know how to authenticate against the received traps/informs. If it is SNMPv2, it is quite easy – you just need to allow particular community strings and also explicitly say that our snmptrap.sh must be executed upon a received trap/inform. Do this via /etc/snmp/snmptrapd.conf file. Example of such file:
authCommunity log,execute public
authCommunity log,execute mwl-snmp
authCommunity log,execute racom-snmp
traphandle default /bin/bash /usr/lib/zabbix/externalscripts/snmptrap.sh
With SNMPv3 it gets more complicated.
| Important | |
|---|---|
Due to a bug in SNMP daemon, SNMPv3 informs are not working and cannot be selected. Once this 3rd party daemon is fixed, we add the functionality back to our RipEX2 release. RipEX2 FW version is 2.0.10.0 or older. |
For SNMPv3 Informs (not traps), you need to create the user via createUser command. Stop the snmptrapd daemon:
# systemctl stop snmptrapd
Now, edit the /etc/snmp/snmptrapd.conf file and add these lines:
createUser racom MD5 "racom1234" DES "racom5678"
authUser log,execute,net racom
This should add the User “racom” with MD5 and DES secrets and authenticate him. Save the changes and start the snmptrapd daemon.
# systemctl start snmptrapd
Now, the SNMPv3 informs can be successfully received and used.
SNMPv3 Traps need a bit different command. Everything is the same, but the EngineID must be configured.
Each RipEX2 has a unique EngineID by default, you can also generate your own. This was explained in Section 2.4, “RipEX2 SNMP Settings”.
| Note | |
|---|---|
If you generate your own EngineID, it is given as a text, but the EngineID is then read as HEX number. E.g. A generated EngineID in GUI is: “UULhM_jp2ObIoN8CVP8aUoaG2Hg”, but the Engine ID in HEX format which you need to set in snmptrapd.conf file is “800083130455554c684d5f6a70324f62496f4e384356503861556f6147324867”. |
Stop the snmptrapd daemon again and add a similar line in the /etc/snmp/snmptrapd.conf file:
createUser -e 80008313030002a9200ad3 racom MD5 "racom1234" DES "racom5678"
authUser log,execute,net racom
This creates a “racom” user the same way as for the Informs, but the EngineID 80008313030002a9200ad3 is fixed and must correspond to the created one in RipEX2 web interface.
| Note | |
|---|---|
The same procedure must be met for any other SNMPv3 devices and their SNMPv3 traps/informs (not just RipEX2). |
Once you apply all the mentioned changes, it is suggested to reboot your Linux OS and check the functionality.
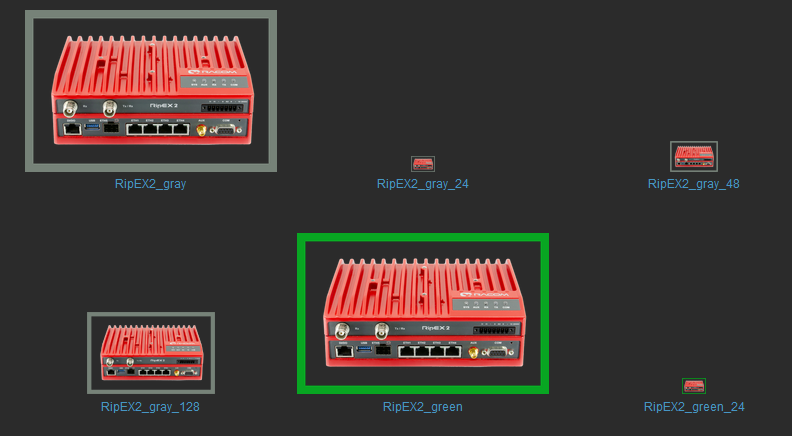
RipEX2 images
Hosts can be displayed in graphs. For such a purpose, we created multiple RipEX2 images of different size and with different borders (e.g., red border in case the unit is in a problem state). These images are included in the mentioned .zip file with RipEX2 template. Import them one by one in Administration – General – Images menu, or via directly via MySQL.
Now, Zabbix should be ready for monitoring RipEX2 network. This chapter gives you a brief procedure to get started, but feel free to utilize different approach.
First, we suggest to create a Host – probably RipEX2 Base station accessible via Ethernet from Zabbix. Go to the Configuration – Hosts menu and click on the “Create host” button on top right corner.
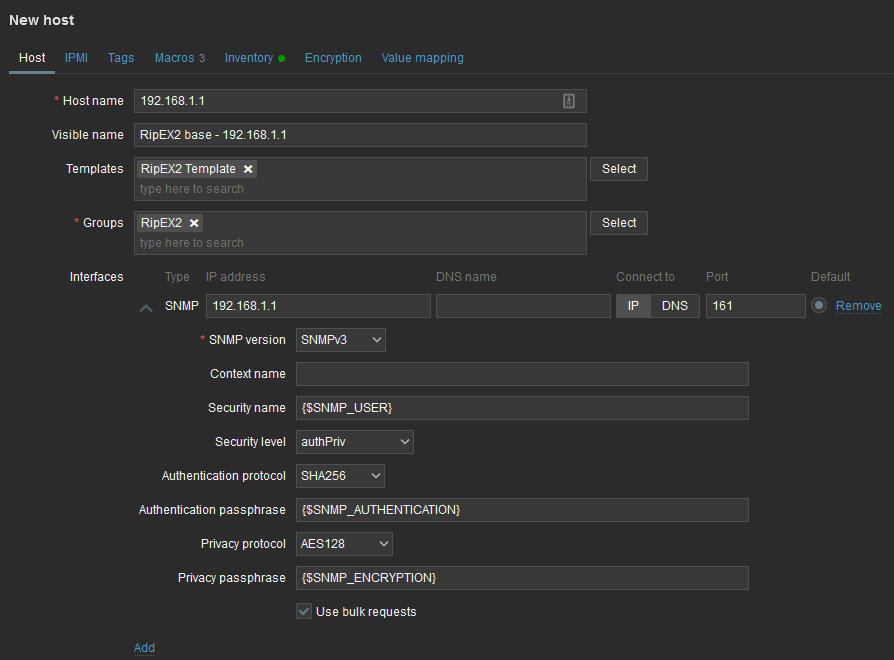
Always put the IP address of the unit to the “Host name” field so the SNMP notifications work (the script works with IP addresses). The “Visible name” can be set to any required value.
Select the “RipEX2 Template” so that the unit is preconfigured with all RipEX2 supported Items. Create a new, or add it to an existing one, RipEX2 group. You can name it as required – e.g., based on RipEX2 network location or particular customer company name. Set the SNMP Interface:
IP address
Port (usually UDP/161)
SNMP version (either v2c, or v3)
If v2c, set the community string to MACRO {$SNMP_COMMUNITY}
If v3, set the values according to your RipEX2 setup
Security name – {$SNMP_USER}
Authentication passphrase – {$SNMP_AUTHENTICATION}
Privacy passphrase – {$SNMP_ENCRYPTION}
Now, check and change MACROs in “Macros” tab
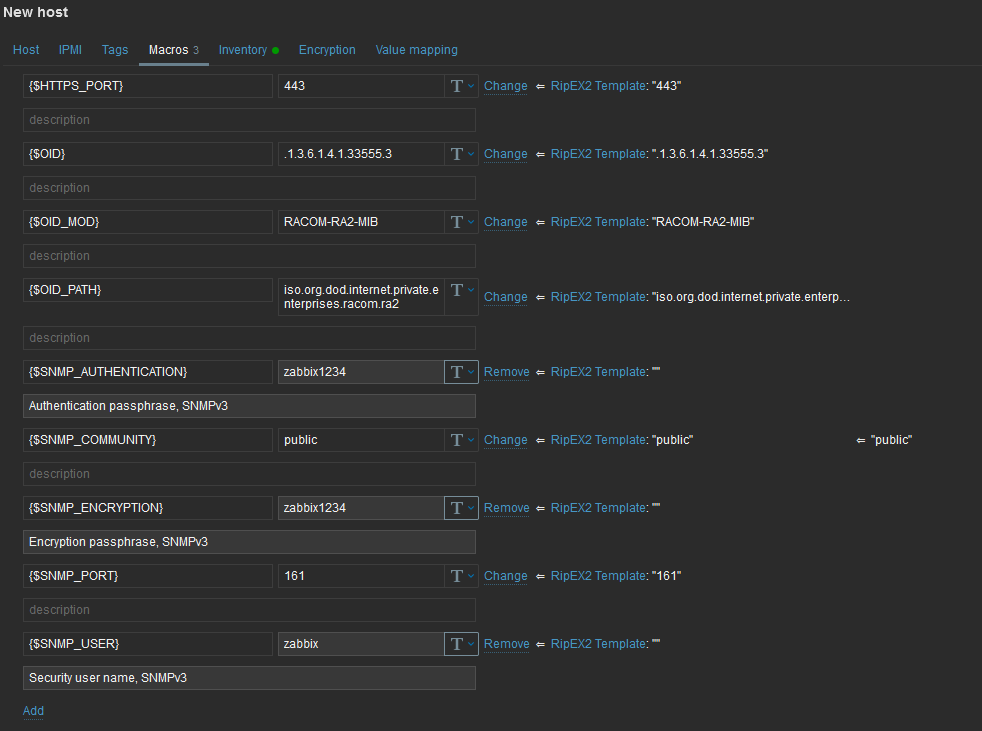
You can either change the values in Template so it is the same in all your RipEX2 units, or you can set it per Host.
Check the “Use bulk requests” option because it optimizes data traffic being sent
Verify the Inventory tab – it should be set to “Automatic” so some of the values are automatically filled by SNMP queries. Click on the “Add” button – a new Host is created.
But the host is not monitored yet, because all the Items and Discoveries are disabled by default.
Only monitor the values which you really need and with reasonable update times. This is important for units accessible via the Radio channel – so that you limit data being sent over the narrow RipEX2 radio network.
Default update intervals are either 15 minutes, or 1 day. A template keeps up to 1 year of trends/history.
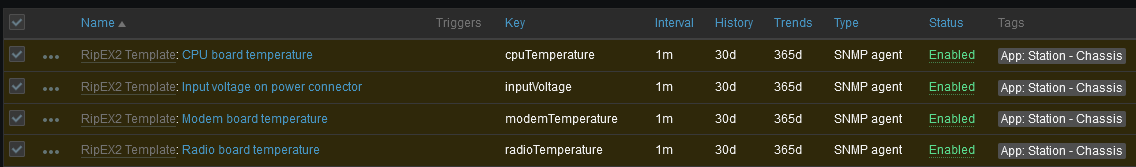
Go to the Host’s Items and enable required Items, you can also edit the SNMP query intervals and other parameters. As an example, we enable 4 Items with an App “tag” equal to “Station – Chassis” and we decrease Interval to just 1 minute.
If you want Traps/Informs to be working, you need to enable particular traps with App tag equal to TRAPS and enable Triggers accordingly (i.e., if you enable “Input voltage too high” Item, you also need to enable a Trigger for this Item).
Last important menu is “Discovered rules”. They are already explained on previous pages. If you want to discover particular Items, just enable required Discovery rule(s). E.g., enable “Discovery – Radio Signal Statistics” for receiving values from Statistics table containing RSS, MSE etc. with all neighbouring RipEX2 units.
You can check the data in the Monitoring – Latest data menu. Filter the values are required. All numeric values can be depicted in graphs. String values have their own history.
Other units can be easily added by a “Clone” button from this Host configuration. Just change appropriate IP addresses and ports. Divide them into groups (e.g., geographically). Choose wisely the monitored values and enabled discovery rules.
This application note cannot target all possible information about Zabbix and its usage. Check Zabbix documentation and Google forums for general help and guides. The following section provides several hints and tips for quicker and easier RipEX2 network monitoring. Information provided might not be fully explained or might be different in any other Zabbix version other than 6.0 LTS.
Having a map is handy way for a network overview. On a single map, or multiple maps (even hierarchical) you may see all RipEX2 units (and any other devices) and their status overview. There can be a plain/empty background, or e.g., some picture of a map (static).
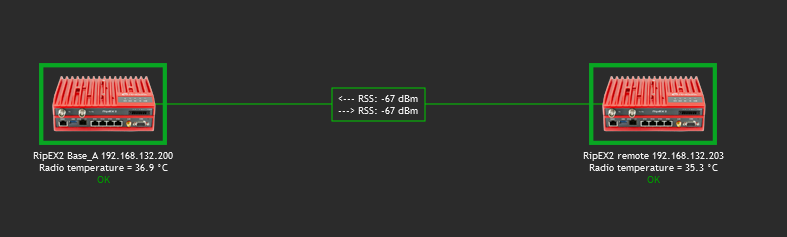
On the map above, we can see two RipEX2 units with a displayed name and current Radio temperature. If the unit has no Problem, an “OK” message is displayed and the Host borders are in green color. We also depict a radio link between these units and its RSS values. Details:
Host details:
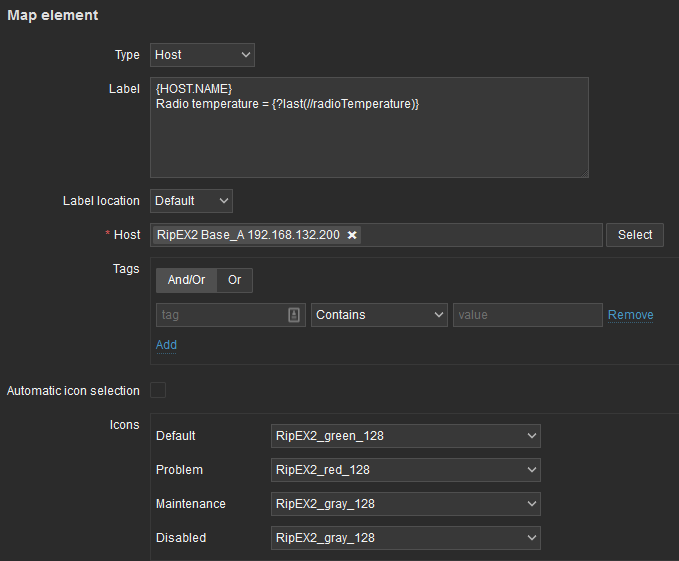
Label is set as follows:
{HOST.NAME}
Radio temperature = {?last(//radioTemperature)}
Select a particular host and you can change icons for various situations.
Example of the link Label:
<--- RSS: {?last(/192.168.132.200/radioSignalRssAvg[10.10.10.2])}
---> RSS: {?last(/192.168.132.203/radioSignalRssAvg[10.10.10.1])}
Even the link color can change in time – for example lower RSS than -90 dBm. You can create your own Trigger monitoring average RSS values.
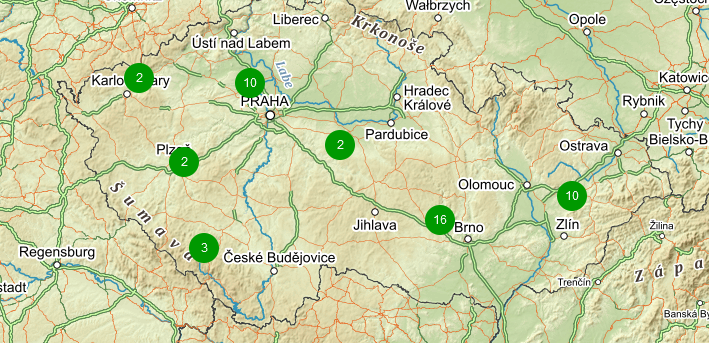
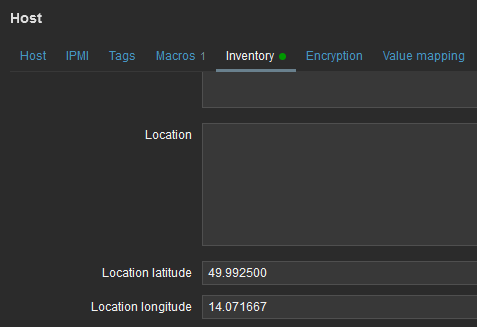
New feature from 6.0 LTS Zabbix version are Geographical maps. If you add GPS coordinates to your RipEX2 hosts, you can display them on geographical maps.
First, you need to add GPS coordinates in the Host Inventory.
Another step is to enable and configure Geographical graphs. Go to Administration – General – Geographical maps menu. Set the required map source/provider. There is a list of default supported map sources, but you can also add “other”. Here is the example for Czech mapy.cz map source.
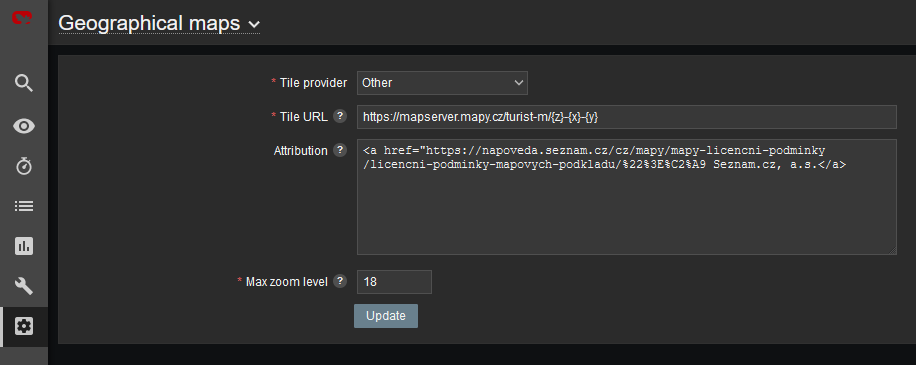
Tile URL: https://mapserver.mapy.cz/turist-m/{z}-{x}-{y}
Attribution: <a href=”https://napoveda.seznam.cz/cz/mapy/mapy-licencni-podminky/licencni-podminky-mapovych-podkladu/%22%3E%C2%A9 Seznam.cz, a.s.</a>
Max zoom level: 18
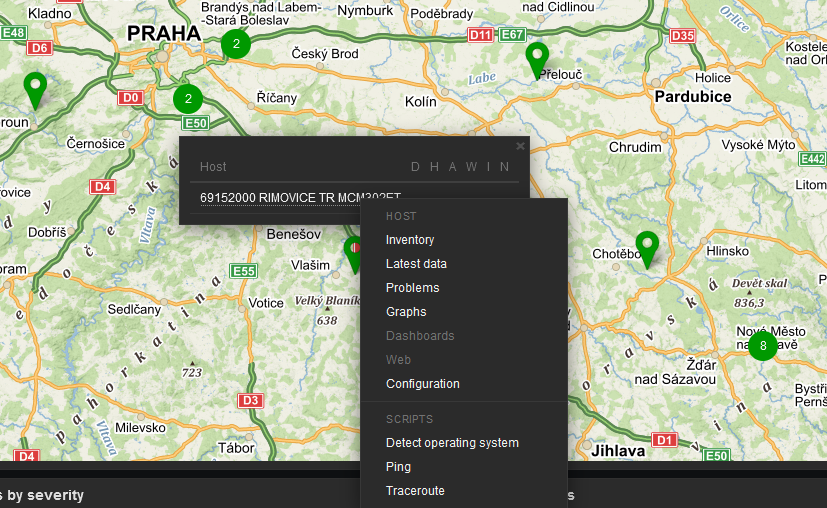
The last step is to add Geographical map to your Dashboard. Edit the dashboard and add “Geomap” widget. Select its name, host group(s) and host(s). Save the changes.
Within the map, you can use a “zoom” feature. You can either see multiple hosts within one icon, or one icon is one host (it is zoomed enough). You can then be forwarded into particular menus etc. Color of the Icons can be changed upon Host status. Read more in Zabbix documentation.
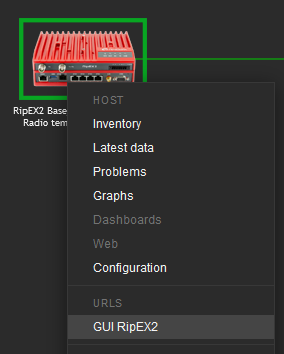
Units’ GUI can be accessed from Zabbix web interface from multiple menus.
A typical one is from simple maps. Configure the URL within the Host on the map and once you click on the Host in this map afterwards, you can be forwarded there. Keep in mind it is not possible from geographical maps.
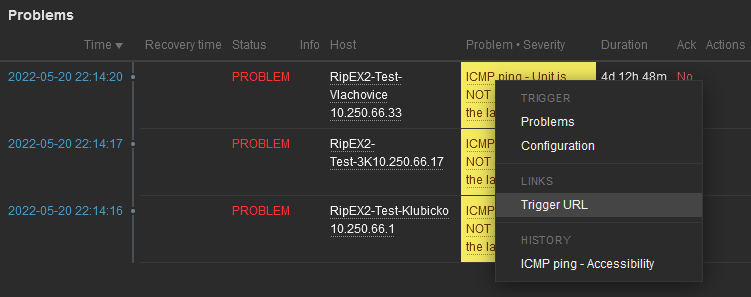
Another way is a link from Triggers so that if a Problem occurs, you can quickly go to the required web interface.
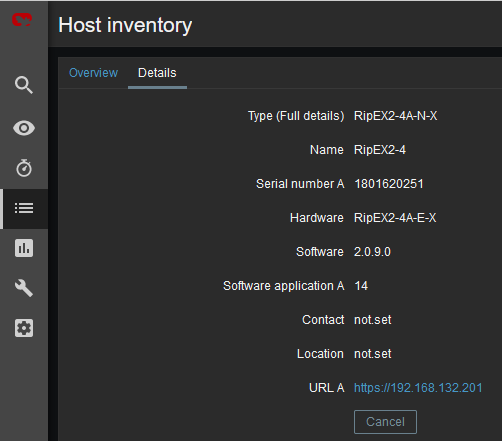
The third option is to use Inventory for configuring URL. For every Host, you can enable the Inventory (serial number, OS, host type, …). Within many Inventory options, the URL can be defined.
Another useful feature is generating scheduled reports. You need to configure Scheduled reports in general. Once you have it, go to the Report – Scheduled reports menu and create a new one. Basically, Zabbix can send multiple users in regular intervals its Dashboard(s) as PDF.
More information e.g., here:
https://www.zabbix.com/documentation/current/en/manual/config/reports#configuration
In case of any issue within your network, e.g., drop in the signal quality, or the unit being unreachable, Zabbix can automatically send an e-mail to predefined e-mail addresses. See the following example for your reference, but customize it to suit your needs.
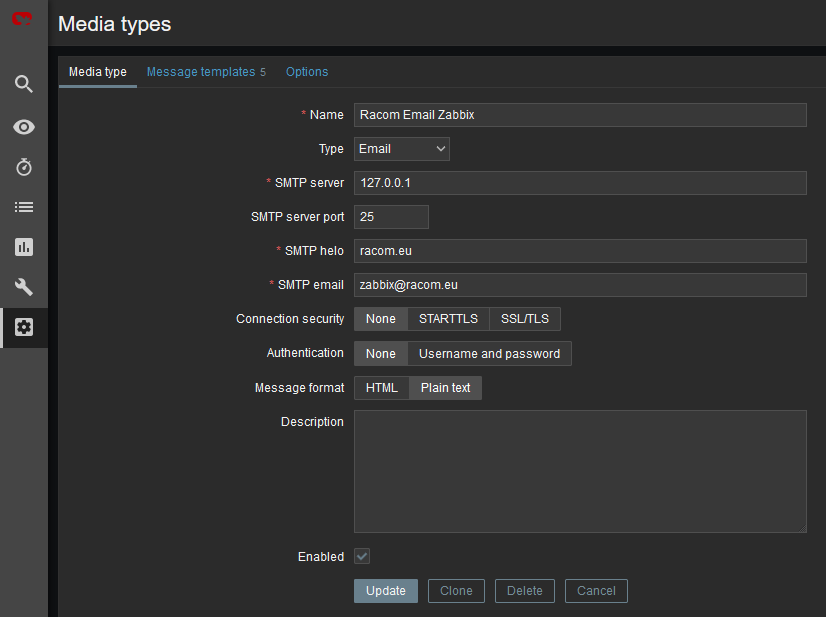
The e-mail can be set in the Administration – Media Types menu. Edit the E-mail type corresponding to your server settings. In our example, we use our own SMTP server reachable from Zabbix server. No special security or password is required. You should be able to use any SMTP server.
The e-mails are sent to the users’ e-mail addresses. Go to the Administration – Users menu and configure the required e-mail addresses within the user’s details (Media).
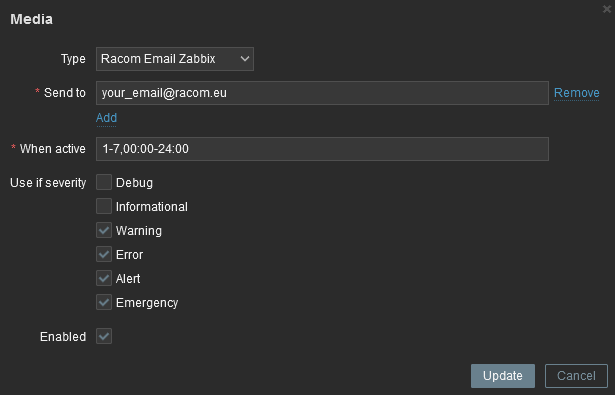
You define the time when the e-mail will be sent (e.g., do not send it over the night) and the severity of the issue (e.g., send me the e-mail just in case of a critical issue).
The last step is to configure the action – configure which issue causes the e-mail to be sent. Go to the Configuration – Actions – Trigger actions menu and create a new Action. Set a Name of the Action and its Conditions – trigger severities and host group are used within the screenshot below.
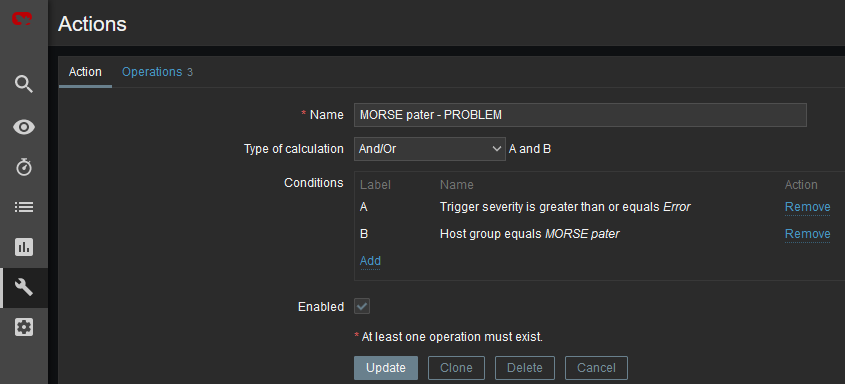
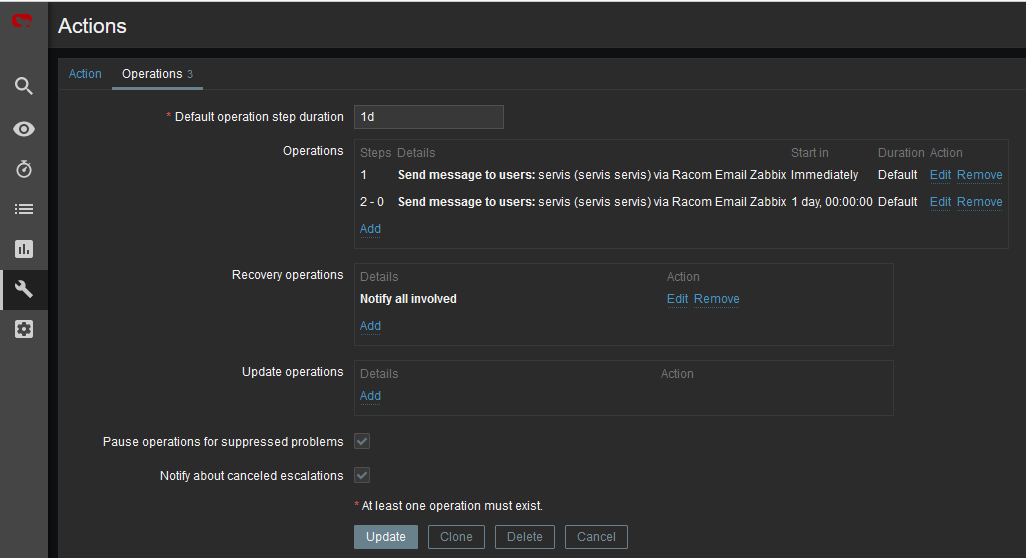
Within the Operations tab, define one or multiple operations. In the example, once the Problem occurs, Zabbix sends an email. It sends such email every other day until the problem is fixed.
We also send a Recovery email to all involved recipients.
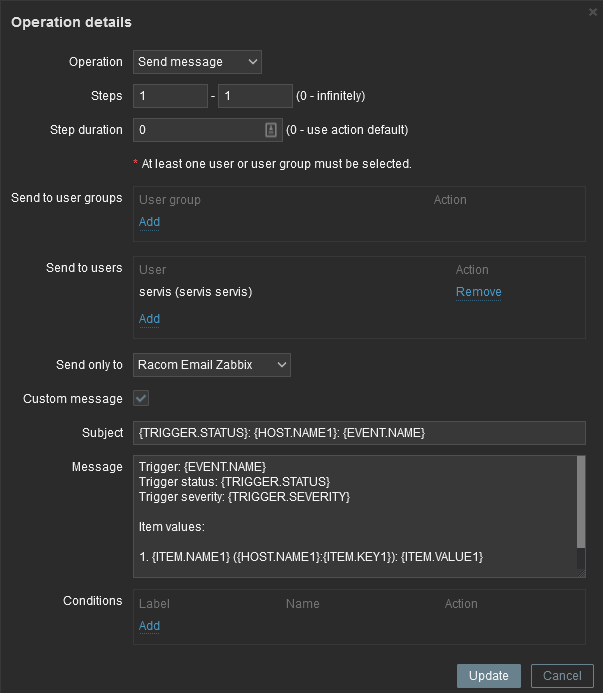
Usually, you will use the MACROs for the e-mail body/subject. In this example, the Subject of the email will consist of the host’s Name, Trigger status (Problem or OK) and Event Name. Within the body of the message, there can be additional information such as the Trigger Severity, URL and the Issue details.
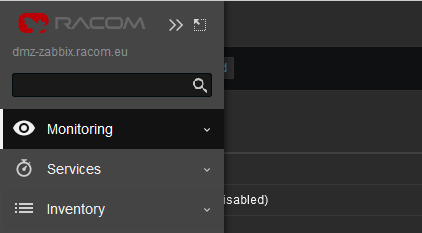
Zabbix 6.0 LTS offers you to use your own company’s branding instead of Zabbix ones, or RACOM logos in case of using RZA6.
General and brief procedure is described here:
https://www.zabbix.com/documentation/current/en/manual/web_interface/rebranding
For the RZA6, we created a file /usr/share/zabbix/local/conf/brand.conf.php with this content:
<?php
return [
'BRAND_LOGO' => 'racom/racom_logo.png',
'BRAND_LOGO_SIDEBAR' => 'racom/racom_logo.png',
'BRAND_LOGO_SIDEBAR_COMPACT' => 'racom/racom_logo_compact.png',
#'BRAND_HELP_URL' => 'https://www.racom.eu/ APP NOTE LINK '
];
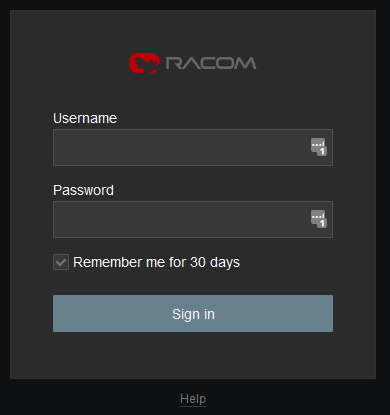
Logos were scaled to 140×20 and 20×13 (compact one). The logos are placed in /usr/share/zabbix/racom/ directory. After these changes, the Login screen can look like:
If you need any additional help or information, don’t hesitate to contact us at support@racom.eu. We are ready and happy to help you.
We do recommend using our RZA6 solution. If not in your real network, then as a start for getting familiar with RipEX2 SNMP and Zabbix NMS, because RZA6 has many configuration steps pre-configured and done.