
RACOM has many years of experience with Network Management System (NMS) – 15 years ago we started to build our own proprietary NMS called RANEC. RANEC is built upon similar principles like today’s NMS. It was optimized to be used within narrow bandwidth radio networks so the customers could get all the valuable information about the network.
The NMS development and customer requirements to integrate our proprietary solution into their NMS have led us to implement Simple Network Management Protocol (SNMP) support for all the new generation RACOM products.
Many RACOM customers use their own NMS, in which they need to manage our products. We can offer them this opportunity with general SNMP implementation. The following text is intended for all customers who are searching for the network management system applied to the RACOM products. The text will demonstrate the possibilities of a standardised NMS.
Almost any NMS can be used for accessing SNMP values. The Zabbix open source monitoring system was chosen as a demonstration of basic functionalities. We have prepared a Zabbix Live demo so you can browse the Zabbix web interface and see most of the important features.
| Tip | |
|---|---|
Contact our Sales department for the Zabbix Live demo credentials. |
Please find more details in the following chapters.
Zabbix authors provide the following description:
Zabbix is the ultimate enterprise-level software designed for monitoring availability and performance of IT infrastructure components. Zabbix is open source and comes at no cost.
With Zabbix it is possible to gather virtually limitless types of data from the network. High performance real-time monitoring means that tens of thousands of servers, virtual machines and network devices can be monitored simultaneously. Along with storing the data, visualization features are available (overviews, maps, graphs, screens, etc), as well as very flexible ways of analyzing the data for the purpose of alerting.
Zabbix offers great performance for data gathering and can be scaled to very large environments. Distributed monitoring options are available with the use of Zabbix proxies. Zabbix comes with a web-based interface, secure user authentication and a flexible user permission schema. Polling and trapping is supported, with native high performance agents gathering data from virtually any popular operating system; agent-less monitoring methods are available as well.
Web monitoring as well as monitoring of VMware virtual machines is possible with Zabbix. Zabbix can automatically discover network servers and devices, as well as perform low-level discovery with methods of automatically assigning performance and availability checks to discovered entities.
For detailed information, see the Zabbix documentation:
You can also read RipEX Application note, Chapter 2: RipEX SNMP Configuration Guide
We believe the Zabbix Live demo will answer most of your questions regarding Zabbix and the SNMP functionality by giving you a quick and easy summary about all our products themselves rather than reading many pages of text.
This chapter will guide you through essential features which Zabbix offers you with the RACOM equipment.
The Zabbix front-end is available for your testing 24/7. Each access password is valid for one week and is changed every Monday at 02:00 GMT. The login name remains the same.
You may access Zabbix live demo here: http://demo-zabbix.racom.eu/zabbix/
Login credentials are as follows:
User name: | customer |
Password: | RacomDemo1234 |
Feel free to go through all the menus. The user access is read-only. You cannot change any configuration parameters.
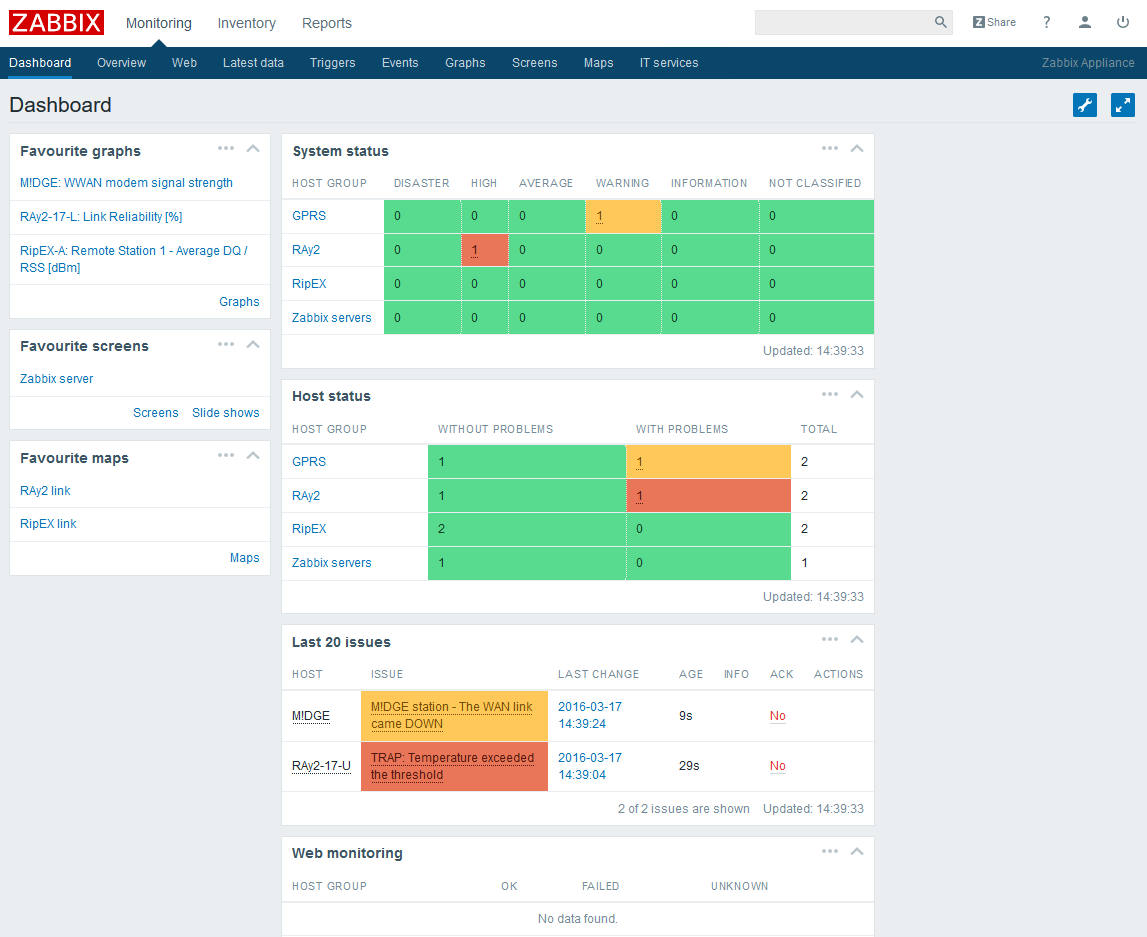
Personal Dashboard is displayed after you login. With full-access you would be able to change the layout as you wish.
On the following picture, you can see that NMS monitors two RAy units, two RipEX units and two GPRS units (M!DGE and MG102). Zabbix is monitoring itself too.
Several triggers were defined to display the warning if any unit is in the undesired state (e.g. modem temperature is too high, RSS level is out of the threshold range, etc.). In our example, there is a problem events with RAy2-17-U unit (temperature is too high) and one event with M!DGE unit (WAN interface is down).
On the left side Zabbix menu, you can add favourite graphs, screens and maps. We provide several examples which are described in the following sections.
The main Zabbix navigation bar is at the top of the screen.
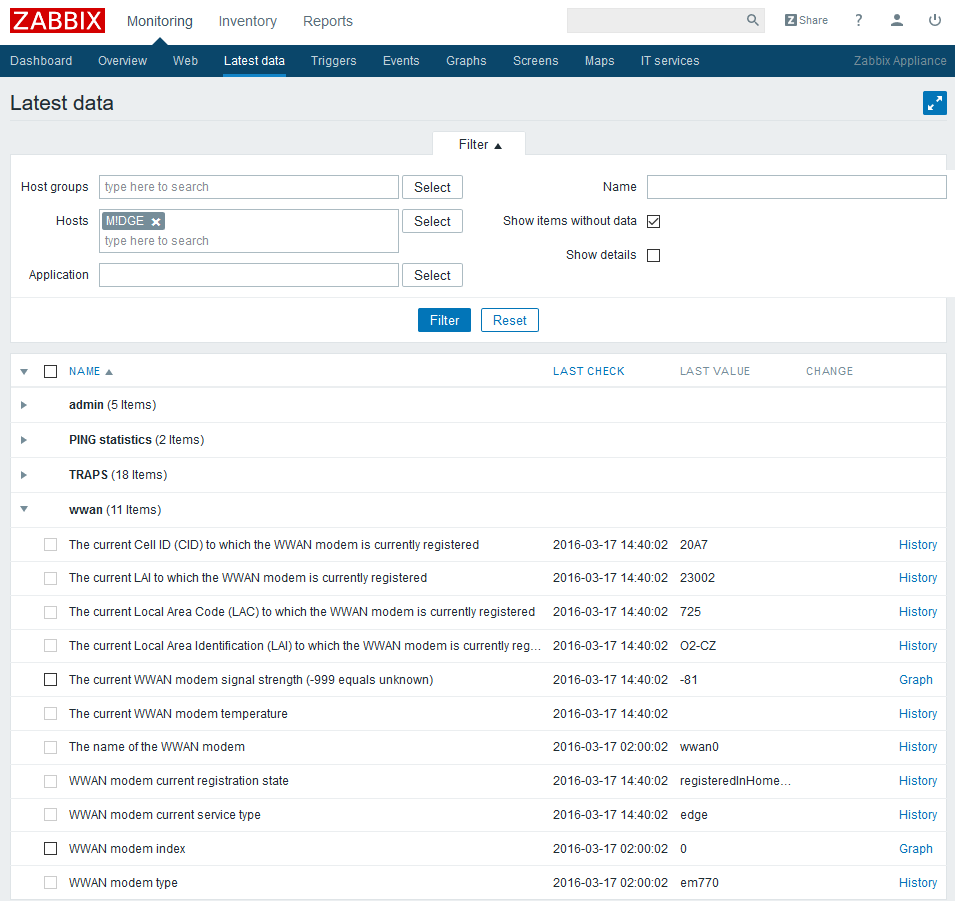
You can see all monitored values of all monitored units in this menu. On the following example, Zabbix displays M!DGE WWAN statistics (e.g. current signal strength, Local Area Identification – LAI, …).
We provide many values which can be obtained from our products. Just go through all of them to see the details.
For every value, Zabbix provides its history. If the value is numerical, there is also a graph. The history values are stored in MySQL database for a defined time period.
| Note | |
|---|---|
You can use a different database engine in your Zabbix installation. |
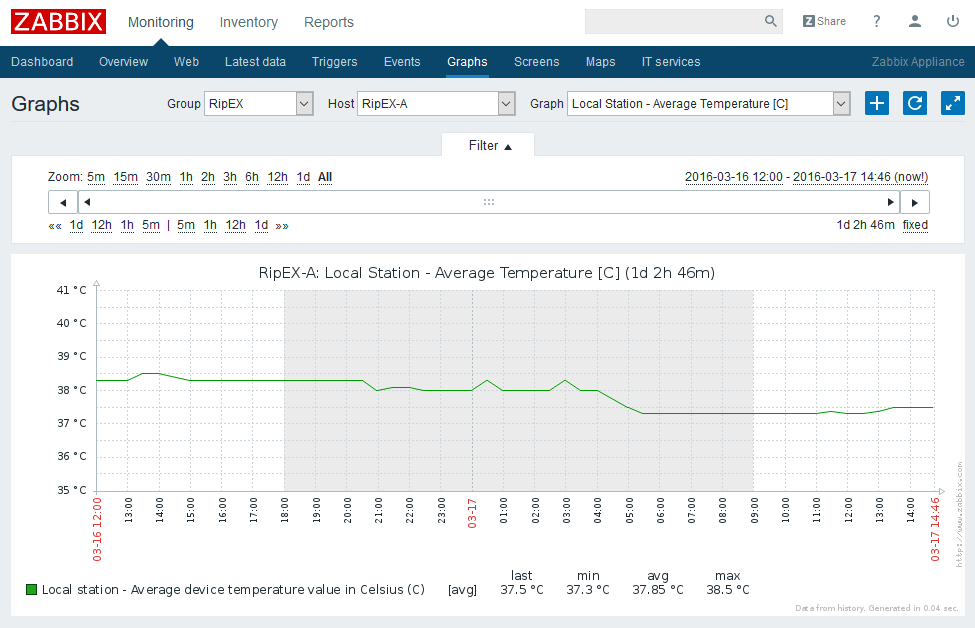
Each numerical monitored value can be displayed as a graph and in every graph, there can be more values displayed.
You can define various colours, types of lines, legends and other parameters. You can also change the time period of the displayed graph.
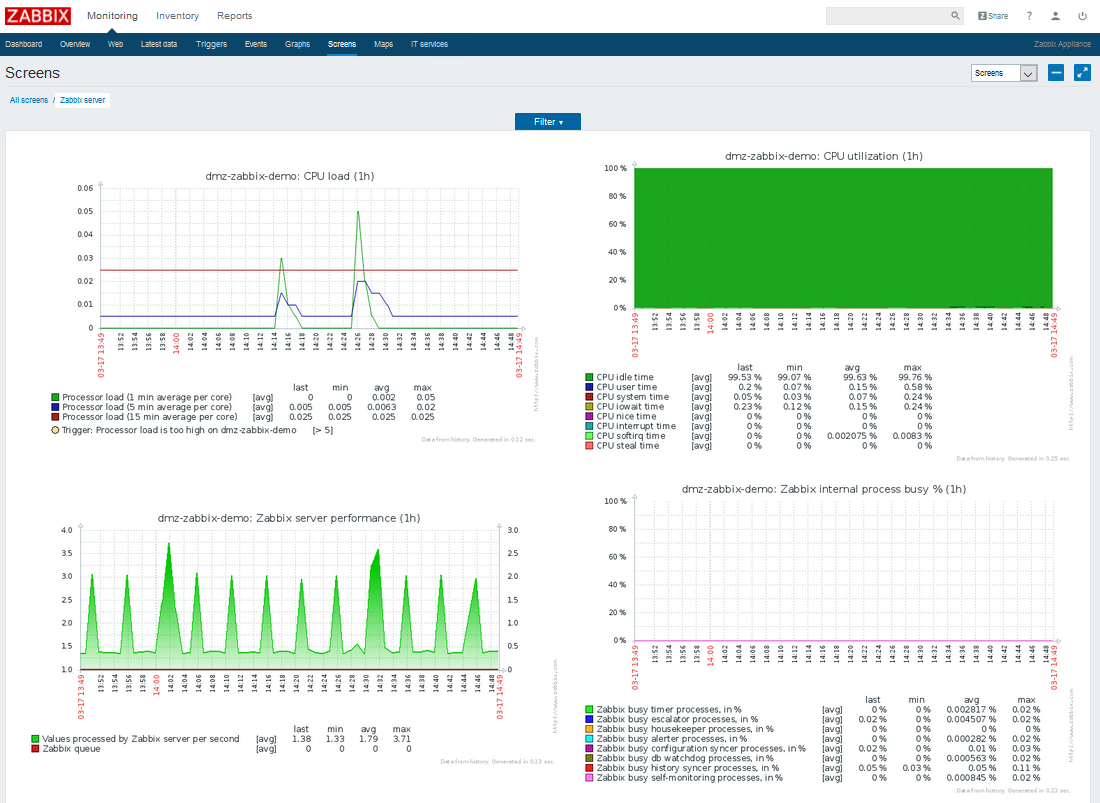
You can define comprehensive screens with many graphs displayed on a single page.
In the example below, we have Zabbix appliance graphs displaying CPU utilization and Zabbix performance.
Zabbix offers the possibility to display user-defined maps. You can upload any background image and insert any unit on this map. For each unit, you can display various statistics and you can see each unit’s status.
In our example, there are two linked RipEX units with temperature, RSS and DQ values. The background image is the raster map of Nové Město na Moravě.
User-defined scripts can be executed on the units. As an example in our Demo Zabbix, you can check the current RSS value or do the configuration backup of RipEX units. Other scripts are supported by RAy2 units.
| Note | |
|---|---|
Any user-defined icon can be imported into the Zabbix, which can be coloured according to unit status. |
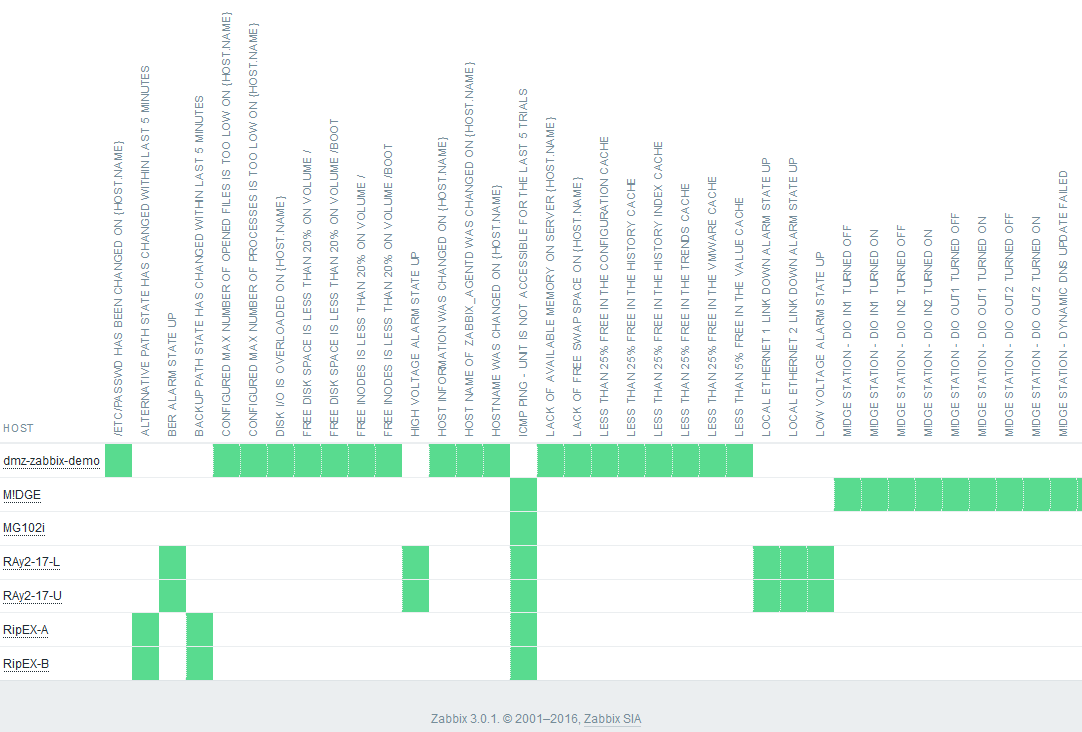
The overview menu gives you a quick summary of the states of all or selected units.
You can also display the values as in the Latest data menu.
The customer account is limited and you cannot create or edit hosts, templates, maps and others. You cannot, for example, see the Administration menu with User accounts or Theme selection. Several menus are accessible, but the information is not displayed.
If you need the Zabbix with full-access enabled, please install it on your machine or see the Zabbix manual for more detailed documentation.
We have described just a few of the Zabbix features.
Feel free to download the “RipEX Application notes” with SNMP Configuration Guide from https://www.racom.eu, or “RAy2 – Microwave link Application notes” from https://www.racom.eu and go through the Zabbix documentation: http://www.zabbix.com/documentation.php.
Do not hesitate to contact us if you have any questions:
RACOM technical support
team
E-mail:
<support@racom.eu>
Tel.:
+420 565 659 511
RACOM sales
department
Contact your respective sales manager
or our Sales department (<racom@racom.eu>)