RipEX Live demo should answer most of your questions regarding the RipEX product and give you a quick and easy summary about the product itself.
There are two RipEX units connected to each other via a radio channel available 24/7 for testing. The units are set to factory settings every day at 02:00 GMT. Each access password is valid for one week and is changed every Monday at 02:00 GMT. The login name remains the same.
You may access RipEX live demo units on the following IP addresses:
RipEX-A: https://ripexa.racom.eu
RipEX-B: https://ripexb.racom.eu
Use the following credentials: Username = “admin”, Password = “admin”
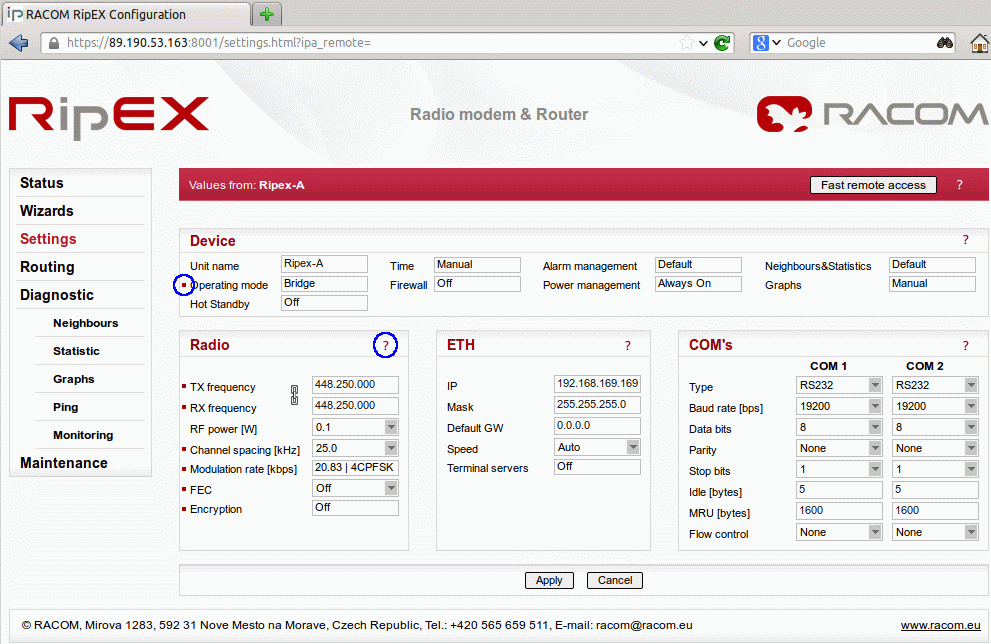
RipEX Live demo settings have the following minor changes compared to RipEX factory settings:
Unit names – RipEX-A and RipEX-B
Ethernet IP addresses – 192.168.169.169 and 192.168.169.170
Modulation rate – 20.83 Kbps (4CPFSK)
RX/TX frequency – 448.250 MHz
RipEX Live demo gives you the most straightforward way to discover and understand all RipEX features and functionalities. Pay attention to the Settings tab, where one can set most configuration parameters. A few clicks will give you an easy summary about the product faster than reading many pages of text.
For detailed parameter descriptions, click on the Help button. Kindly note, balloon tips are also available for some parameters.
Keep in mind that accessibility of some parameters depends on the settings of other parameters. For example serial SCADA protocols on COM ports can only be set when Operating mode is set to the Router mode.
The easiest procedure to configure the units in real usage is to use our Wizard feature. Click on the Wizard tab to be guided through all necessary settings. The Wizard will provide you with helpful notes for respective parameters.
Since the best way to understand the product is through practice, we have described a few practical tests you may wish to conduct.
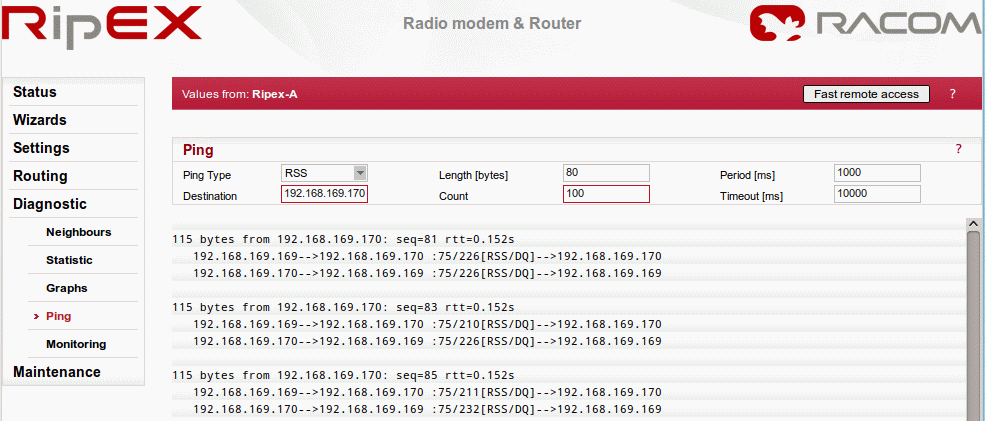
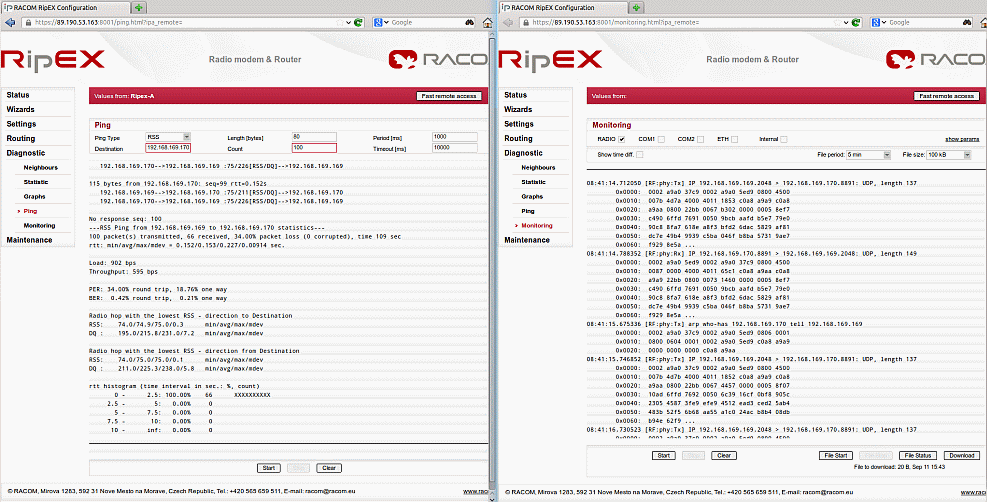
Ping is the basic tool for checking connectivity between two hosts with IP addresses. Because RipEX is a native IP device, ping can also be used for radio link testing.
Go to the Ping tab in the menu. You can either set the Ping Type to „ICMP“ (common ping) or to „RSS“. The RSS type is a RipEX proprietary ping with extended reports.
The destination is the remote RipEX’s IP address. For example when you are locally connected to RipEX-A (192.168.169.169), fill in 192.168.169.170 and vice versa.
When Ping is started, you will see the following on-line report on your screen.
When the specified count of ping packets is transmitted, following detailed summary is displayed. It consists of: throughput usage, PER/BER, RSS, Data Quality (DQ) and Round Trip Time (RTT) histogram. It can be very useful during RipEX unit installation and coverage optimisation.
Please read the detailed Ping report description by clicking on the Help question mark.
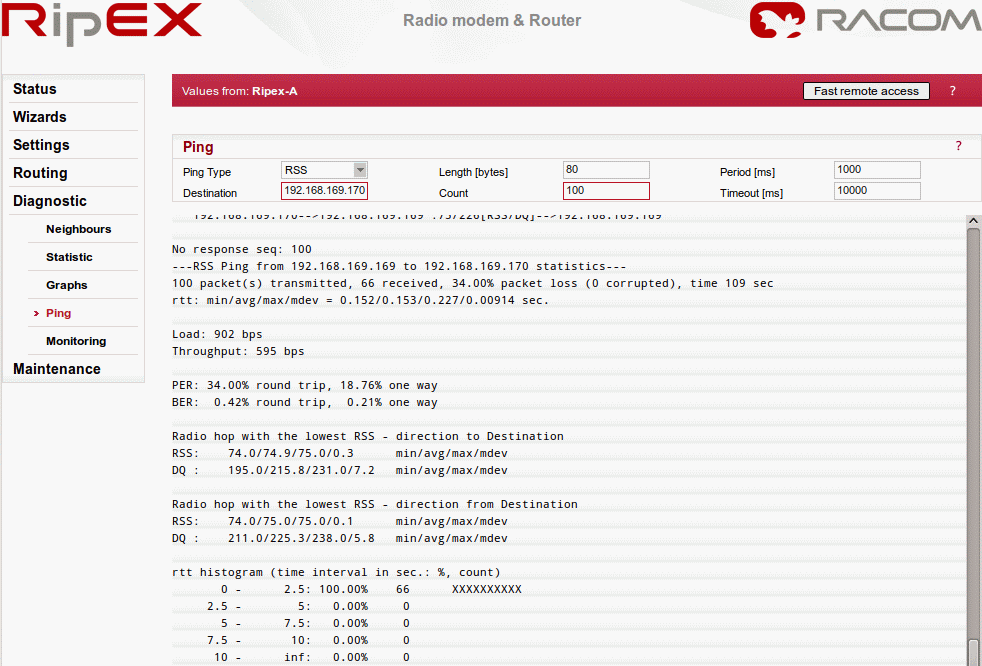
Feel free to change the packet length (Ping option) or the Modulation rate (Settings tab) in order to see the impact on the measured RTT. Do not forget to set the same Modulation rate in both units.
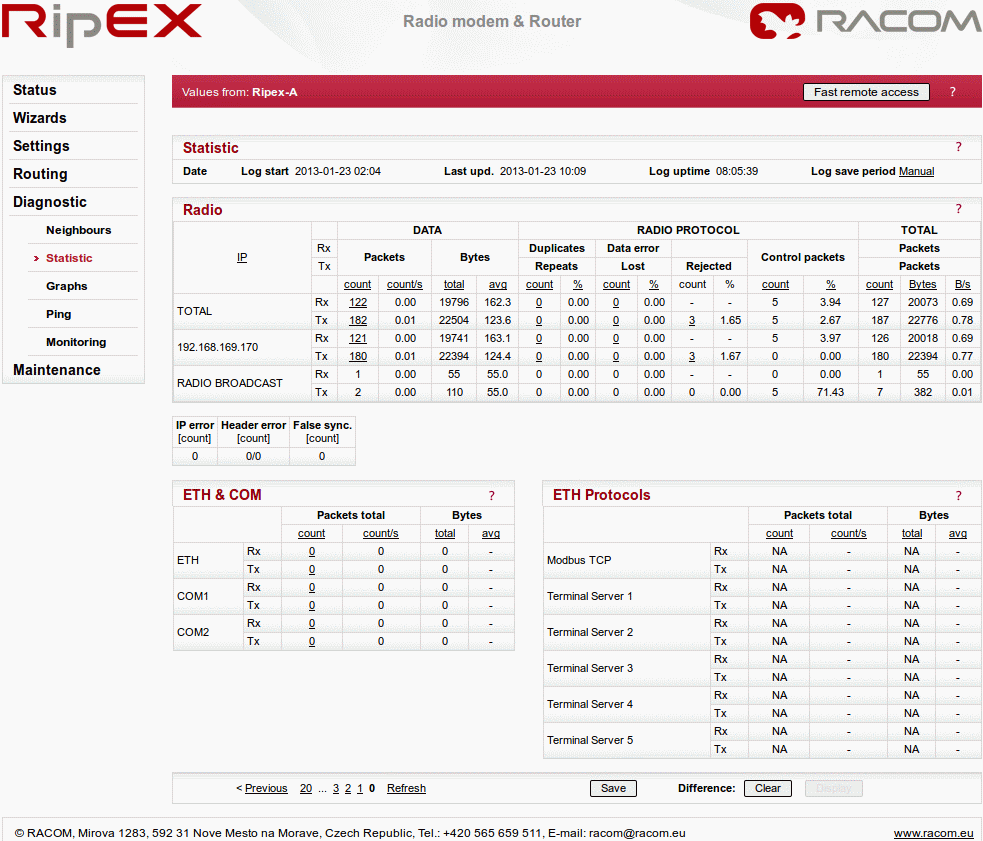
RipEX web interface is equipped with comprehensive and detailed statistics and graphs. One could say, there is an embedded NMS (Network Management System) within RipEX.
Every RipEX can broadcast its Watched values to other reachable RipEX units within the network. Among these Watched values are: current supply voltage, internal temperature, RF output power, Voltage Standing Wave Ratio on the antenna feed line, packet counters on separate interfaces and other values.
These Watched values are displayed in the menu. See the following example with one neighbouring unit.
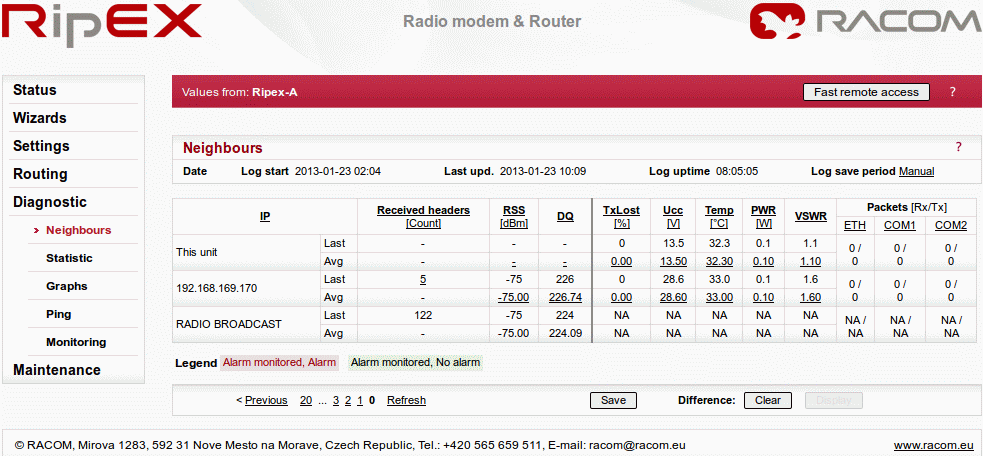
The menu provides you with information about data volume on all interfaces: Radio, Ethernet, COM1 and COM2. The menu displays the number of received and transmitted packets, their sizes and current throughput. Moreover, a detailed division into user and service packets is available for the radio channel.
The quick value descriptions are displayed in the balloon tips (place the cursor on any column header). The detailed description can be read in the respective Help.
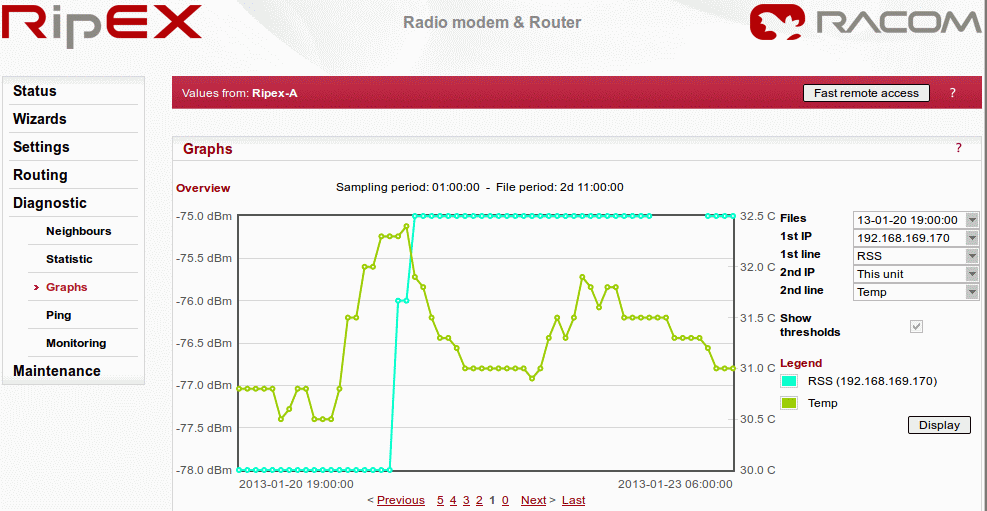
Neighbours and Statistic values can also be displayed as graphs in the menu. Each graph is available in a summary or detailed version and can display two different elements at once. The detailed graphs can be created continuously or can be triggered whenever monitored values are out of their threshold ranges. Each graph can be created based on the values of the unit itself or any other neighbouring unit.
The detailed Graphs description can be read in the respective Help.
Monitoring is an advanced on-line diagnostic tool, which enables detailed communication analysis over any RipEX interface. In addition to all physical interfaces (Radio, Ethernet, COM1 and COM2), several internal interfaces between software modules can be monitored.
Go to the menu and just click on the button. In the default settings, it will display packet timing and payload on the Radio channel.
For example, you can test Monitoring while performing the Ping test .
Note: In order to see both on-line reports (Ping as well as Monitoring), start Ping in a new independent window or panel in your browser.
We have described just a few examples of Live demo usage. Feel free to download the RipEX User manual from https://www.racom.eu or the RipEX Application notes from https://www.racom.eu to conduct further tests.
Do not hesitate to contact us if you have any questions:
RACOM technical support
team
E-mail:
<support@racom.eu>
Tel.:
+420 565 659 511