There are many features provided by the Zabbix software. They are described in the Zabbix Documentation. Below are just a few of them.
You can create Screens. A Screen is a set of various graphs on one page for better overview of your network (temperature, UCC, RF power, …).
You can create Maps. If you administer many stations in many locations, a Map can be a good choice. You can define the background picture (e.g. real maps), various station pictures, station status, various statistics, etc. You can import any icon or background picture you want to use.
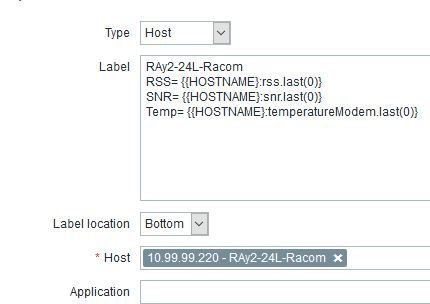
A short example of RAy2 station configuration in Maps:
RAy2 {HOSTNAME}
RSS= {{HOSTNAME}:rss.last(0)}
SNR= {{HOSTNAME}:snr.last(0)}
Temp= {{HOSTNAME}:temperatureModem.last(0)}For the link, you can define the throughput variables to be displayed.
{10.10.0.1:netBitrate.last(0)}
{10.10.0.2:netBitrate.last(0)}
Each map can be divided into several sub-maps. It can be useful for various levels of detail.
