Provides overview information about individual sections of the unit. Each section is linked with an area of Events (see Section 8.4, “Events”).
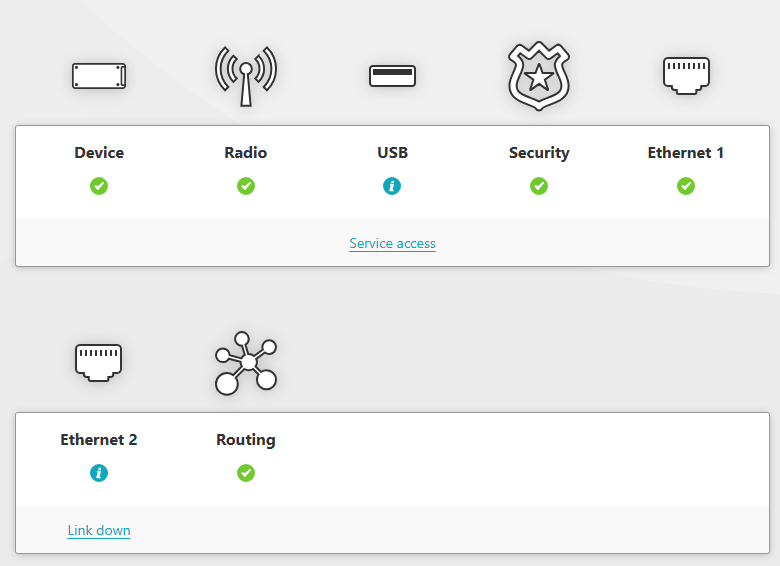
When any event with severity higher than Notice occurs in the unit, corresponding icon will change the color according to the severity of the event, the link leads to further information about the event in the DIAGNOSTICS menu. STATUS also shows and describes alarms in last week which are highlighted under icons. Latest 25 Emergency, Alert, Critical and Error Events are displayed at the bottom of the page.


![[Note]](/images/radost/images/icons/note.png) | Note |
|---|---|
The number of visible Ethernet icons is depended on the units settings. (SETTINGS > Interfaces > Ethernet > Ports) |
To each event an individual severity can be assigned. When multiple Events with different severities are triggered in the same section, the priority goes: Error > Warning > Notice.
Tab. 5.2: Severity icons
 | Unit works flawlessly |
 | Informational, Notice |
 | Warning |
 | Error, Critical, Alert, Emergency |
The Overview section serves to give general information about the WaSP.
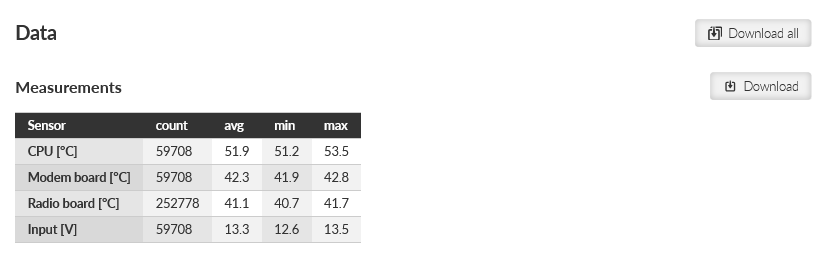
Section Overview – Measurements contains current data measurement (obtained from sensors).
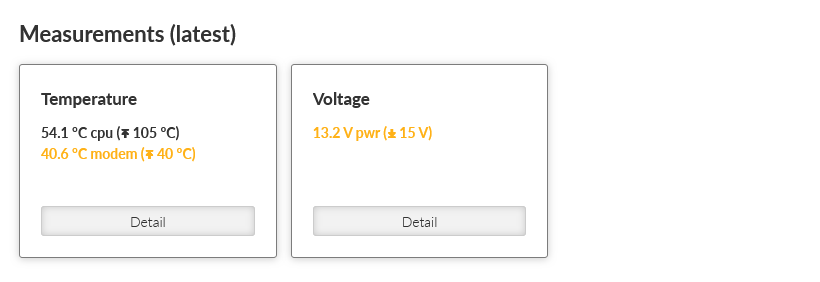
Card Temperature – provides data about temperature (on CPU, modem and radio).
Note If the temperature exceeds its specified range (-45 – +95 °C), the radio receiving/transmitting will be blocked. If the temperature will return to a specified range (-40 – +85 °C), the radio starts receiving/transmitting again.
This feature can be disabled in parameters ADVANCED > Interfaces > Radio > Radio parameters > Block radio in extreme temperatures.
Card Voltage – provides data about voltage measured on input connector.
Arrow-headed symbols (↑, ↓, →) have following meaning:
↑ – Maximum-limit value. An alarm is triggered, when the value (displayed in brackets) is exceeded.
↓ – Minimum-limit value. An alarm is triggered, when the value falls under the value, which is displayed in the brackets.
→- Value is supposed to head to another one.
| Note |
|---|---|
Value measurements are collected once per 10 s (excluding radio interface, where values can be collected once per 10 s or more often – depends on the radio communication character). |
Section Overview – Statistics shows a short view of the statistics over last 15 minutes (from the time of opening the window or pressing Refresh button).
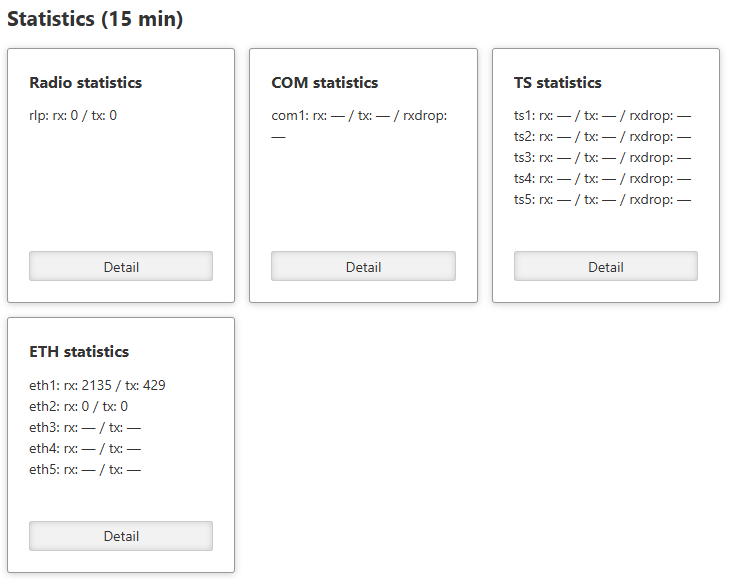
Cards Statistics are always displayed for all interfaces.
If the interface is off, its statistics (record) is displayed as “-“.
Statistics collection is updated every 1 s (each second is possible to see new values).
15-min interval is collected by taking 14 mins from history + seconds passed from current minute.
This section provides more detailed information (data extract) about settings of WaSP unit. It provides also a deeper explanation about some of set values and interfaces. Diagnostic data are provided as well.
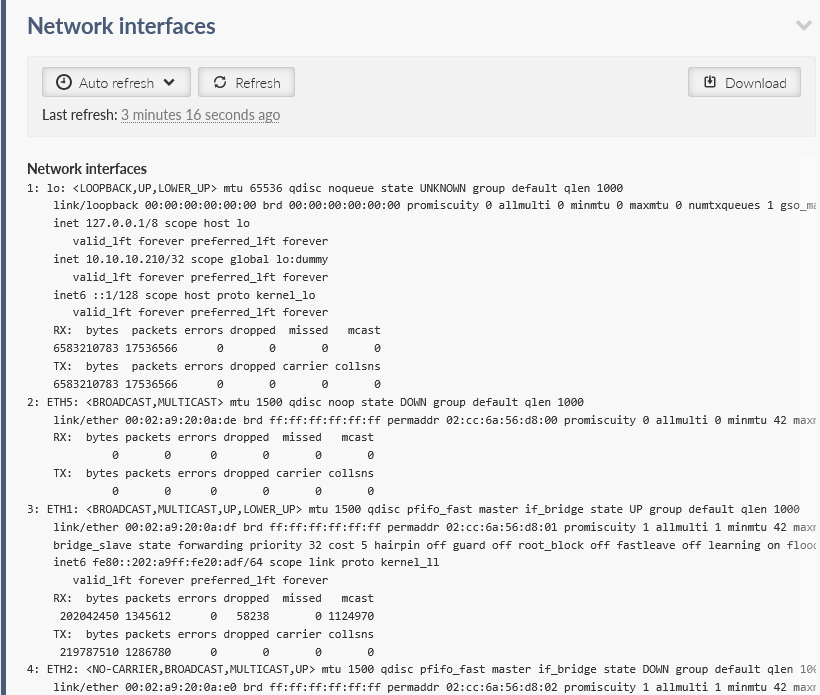
Provides a complete information extract about all active interfaces (addresses, details and statistics included). All interfaces used by the linux router (including all internal interfaces like npi, loop, ag, ip6tnl, etc.) are displayed in this section.
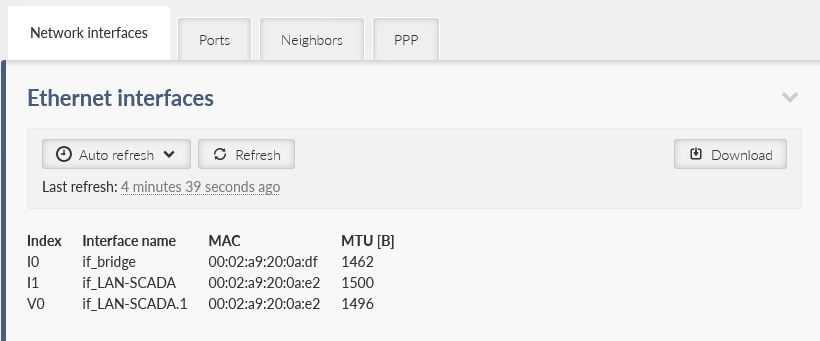
Interfaces used in WaSP units are in general either Bridged ports (BP-L2) or Routed interfaces (RI-L3).
All interfaces used by the linux router (internal interfaces excluded) are displayed in the following list.
- if_<LanIface_Name>
LAN bridge interface RI-L3 type
(SETTINGS > Interfaces > Ethernet > Network interfaces)
- if_<LanVlan_IfName>.<LanVlan_VlanId>
VLAN BP-L2 interface type (if used as a port in LAN bridge) (SETTINGS > Interfaces > Ethernet > Network interfaces>VLAN)
VLAN RI-L3 interface type (if not used as a port in LAN bridge) (SETTINGS > Interfaces > Ethernet > Network interfaces > IP/Subnet > VLAN)
- eth1, eth2
Interface of physical Ethernet ports ETH1 – ETH2, BP-L2 interface type
- eth0
Interface of physical port SFP (ETH5), BP-L2 interface type
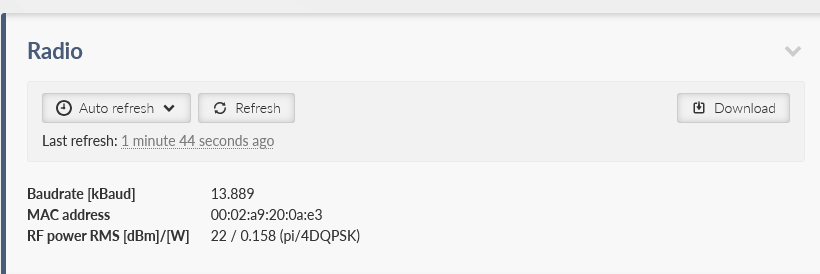
- radio
RF radio interface
BP-L2 interface type when Bridge mode of Radio interface is used (SETTINGS > Interface > Radio)
BP-L2 interface type when Bridge mode of Radio interface is used (SETTINGS > Interface > Radio)
- ext
Bridge interface of the EXT cellular module, RI-L3 interface type (SETTINGS > Interface > Cellular > EXT)
- gre_tap<INDEX>
GRE L2 tunnel interface, BP-L2 interface type (SETTINGS > VPN > GRE > L2)
- gre_tun<INDEX >
GRE L3 tunnel interface, RI-L3 interface type (SETTINGS > VPN > GRE > L3)
- lo
Loopback interface RI-L3 type of interface – The IP addresses of the loopback (ADVANCED > Interfaces > Loopback).
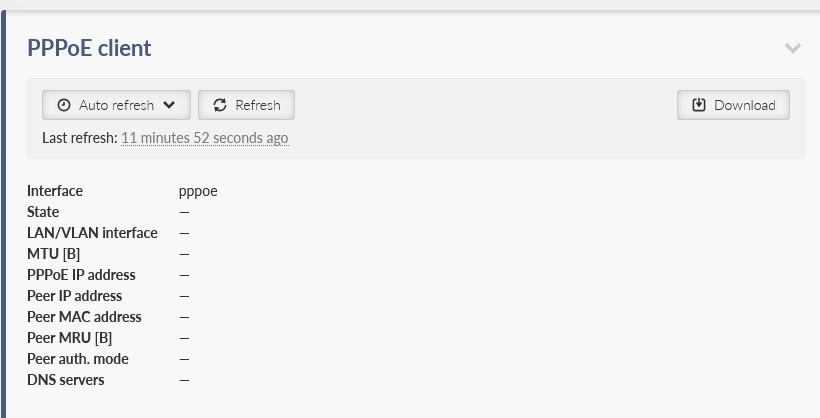
Interface | PPPoE interface name |
State | Current state of the interface |
LAN/VLAN interface | Name of the LAN/VLAN interface on which the PPPoE client is running |
MTU [B] | MTU of the LAN/VLAN interface on which the PPPoE client is running |
IP address | Assigned IP address |
Peer IP address | IP address of the peer (server) |
Peer MAC address | MAC address of the peer (server) |
Peer MRU [B] | Maximum Receive Unit (MRU) in bytes requested by the negotiating peer |
Peer auth. mode | Authentication protocol requested by the peer |
DNS servers | IP addresses of DNS servers, separated by a space |
Provides information about data extract from section Routing.
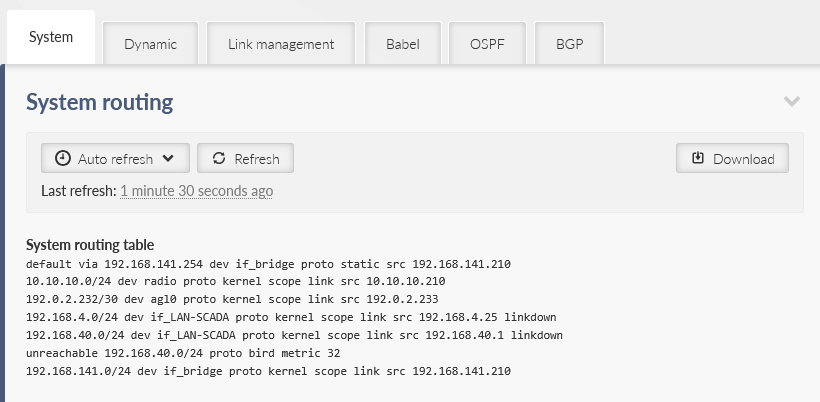
This section is divided into following parts:
System – complete data extract of system routing table. Displays data called by linux command “ip route show”.
Dynamic – complete data extract of internal routing table of dynamic routing service bird master4. Displays data called by linux command “birdcl show route all table master4”.
Babel – data extract of status of Babel protocol. Displays data called by following linux commands: “birdcl show babel interfaces”, “birdcl show babel neighbors”, “birdcl show babel routes”, “birdcl show babel entries”, “birdcl show route all table babel_ipv4”.
OSPF- data extract of status of OSPF protocol. Displays data called by following linux commands: “birdcl show ospf neighbors”, “birdcl show ospf state”, “birdcl show ospf interface”, “birdcl show route all table ospf_ipv4”.
BGP – data extract of status of all BGP protocol instances. Displays data called by following linux commands: “birdcl show protocol ‘”bgp*”‘”, “birdcl show protocol all ‘”bgp*”‘”, “birdcl show route all table bgp_ipv4”.
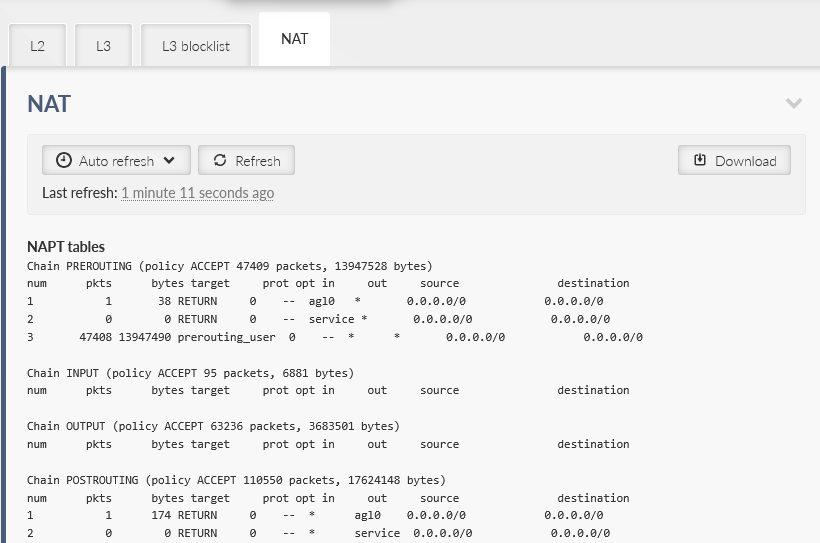
Provides general overview about data extract from sections L2, L3 and NAT.
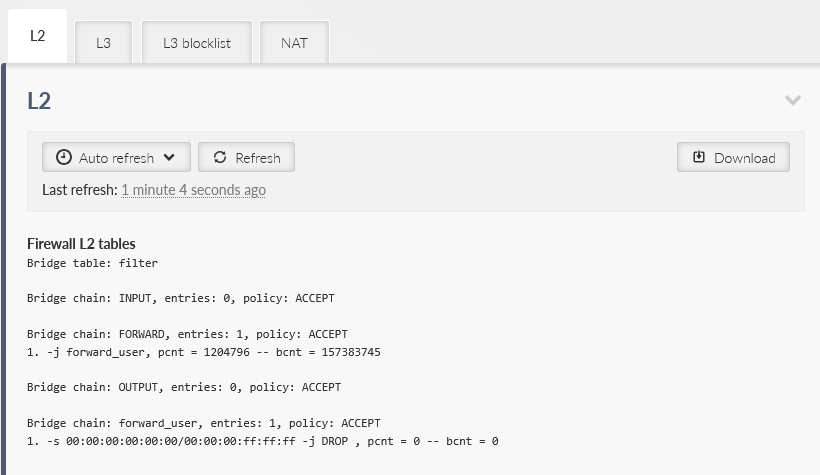
Displays data called by linux command “iptables -L”.
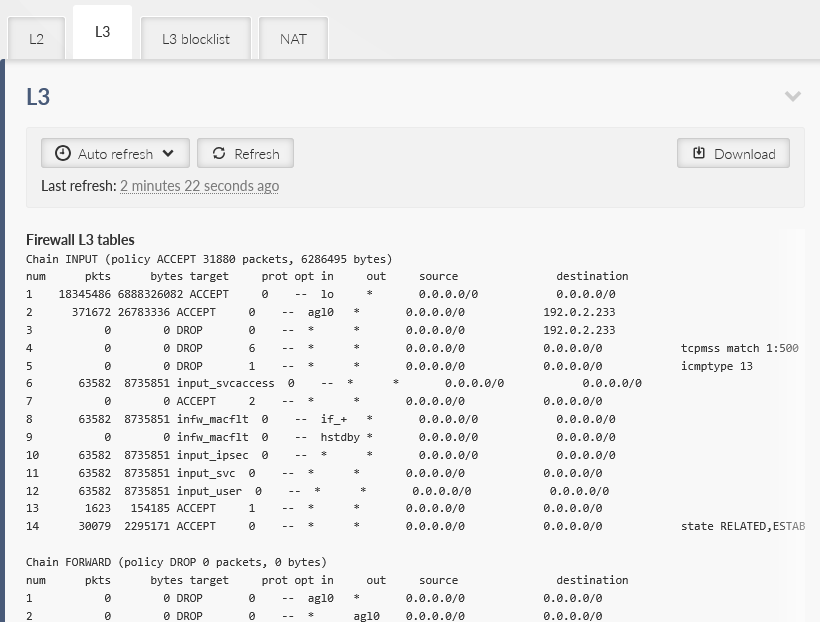
Displays data called by following linux commands “iptables -nvL –line-numbers”.
Listing of the list of banned addresses. Addresses are added to the list if the Action: “Deny, Add to Blocklist” (adding the source address of the incoming packet to the banned list) is configured in the Firewall L3 – Input rules
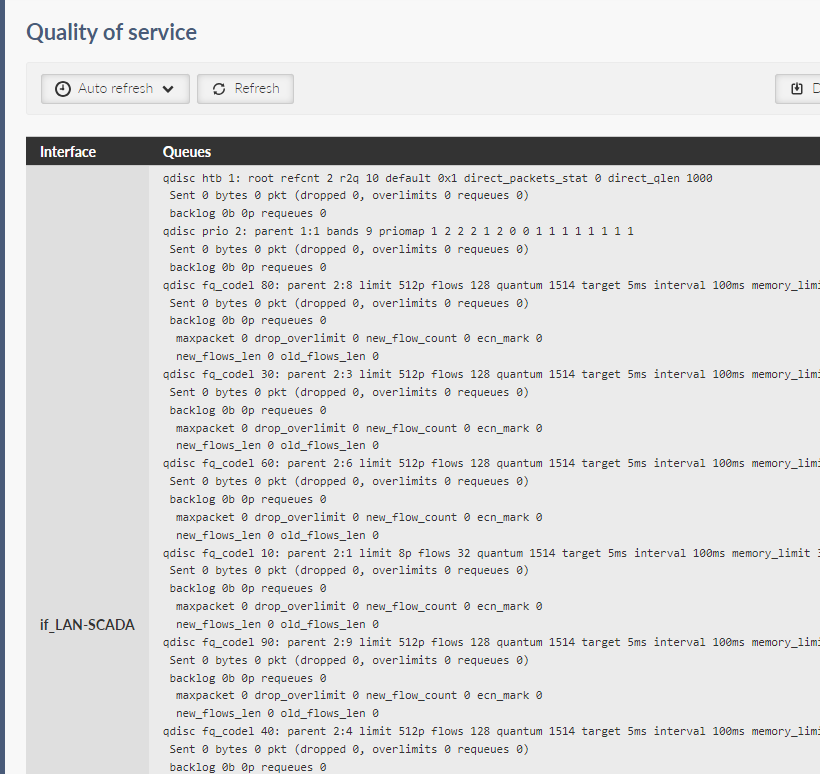
Creates a table about object and statistics extract for each given interface. This table contains:
Name of an interface.
Status and statistics of front disciplines – displays data called by linux command “tc qdisc show”.
Status and statistics of classes – displays data called by linux command “tc class show”.
Status and statistics of filter – displays data called by linux command “tc filter show”.
List of addresses assigned by the DHCP server.
IP address | The assigned IP address of the client |
MAC address | MAC address of the client |
Lease until | The time when the lease expires |
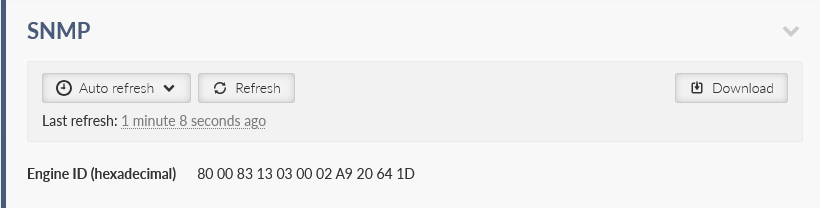
Listing the Engine ID value. The Engine ID is used to uniquely identify the station when communicating with the SNMP manager.
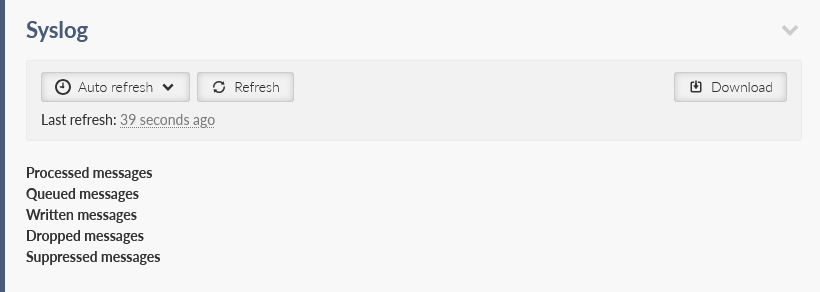
Listing the message counters to a remote Syslog server.
Provides general information about the unit (device).
Basic unit information is provided.
Product code – Identifies the unit hardware.
Serial number – Unique unit identification number.
FW version – Currently installed unit firmware.
Additional unit information is provided which might be requested for advanced diagnostics. Partial description:
Modem board SN – Modem boards system number.
Radio board SN – Radio boards system number.
Radio SW version – Current radio software.
CNF version – Version of the unit configuration. Configuration version is updated if the new firmware version brings major configuration changes leading to incompatibility with the previous configuration. See Section 4.6.2, “Configuration” for more details.
Web client version – Version of the current web client.
Region ID – If the unit is delivered with certain limits applied according to a specific Region (specified when ordering a new unit), the specific Region identification is visible here. No limits are applied if the Region ID is empty (“—”).
Region description – Detailed description of the Region (if active).
This menu serves for collecting data, either from local or remote station and storing them into a package (file). Diagnostic package serves primarily as a help tool, for ’s technical support in case of any potential unit issues. Minimum size of a package is 5kB. Maximum size depends on the amount of radio links contained in the statistics. Diagnostic package is downloaded already compressed, which saves approx. 1/3 of its original size.
Only one package collecting (applies for both local and remote) at a time is supported.
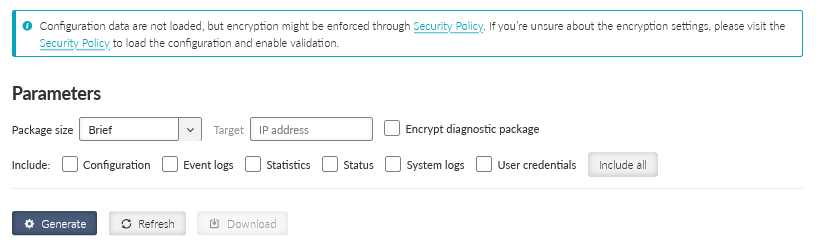
- Package size
List box {Brief; Detailed}, default = “Brief”
Defines the size of the generated package.
- Target
Defines the station, from which is the Diagnostic package being collected.
Diagnostic package from a local station – this parameter stays empty.
Diagnostic package from a remote station – destination IPv4 address of the requested station must be used.
- Encrypt diagnostic package
Allows generating of the diagnostic package as an encrypted .zip file. The rules for the password complexity are set in the SETTINGS > Security > Policy menu. In the same menu, it is possible to set encryption to always be required.
Note You cannot use Windows Explorer for extracting the package. You need to use a software that can work with files encrypted with AES-256 algorithm (e.g. WinZip, WinRAR, 7-zip, Total commander).
- Include
Configuration – configuration of the unit is added to the package (json format)
Event logs – adds a list of events exported to csv
Brief: Last 50 events
Detailed: Last 500 events
Statistics – adds list of statistics exported to csv
Interval of frames statistics: 30 min
Brief: 10 frames
Detailed: 24 frames
Status – lists detailed status of networks devices and services
System logs – adds last system logs
Brief: 100 of current lines from all logs
Detailed: whole logs content
User credentials – adds a list of user accounts
After setting all parameters, click on “Generate” button. By clicking the “Refresh” button update the processing status of the package. Once the package is ready, it can be downloaded by clicking the “Download” button. After its download, the package is deleted from the unit. The package will be deleted even if its download is unsuccessful and if the download is not initiated, the package will be deleted automatically after 24h.
This menu shows all events which occur within the unit history.
For filtering of events you can use the filtering tool. When no filter rules are used, the last 30 events will be displayed after Display button click.
Older events should be displayed using Load more button click, the events which occur during the viewing of this window can be loaded by using Load newer button.
Alarms are displayed in red color, warnings in orange, notices in black and debugs in gray.
Part of the event record is also the information about action really triggered by the event. Changing the settings of a requested action or severity of the event (SETTINGS > Device > Events) does not change information about the events that have already occurred.
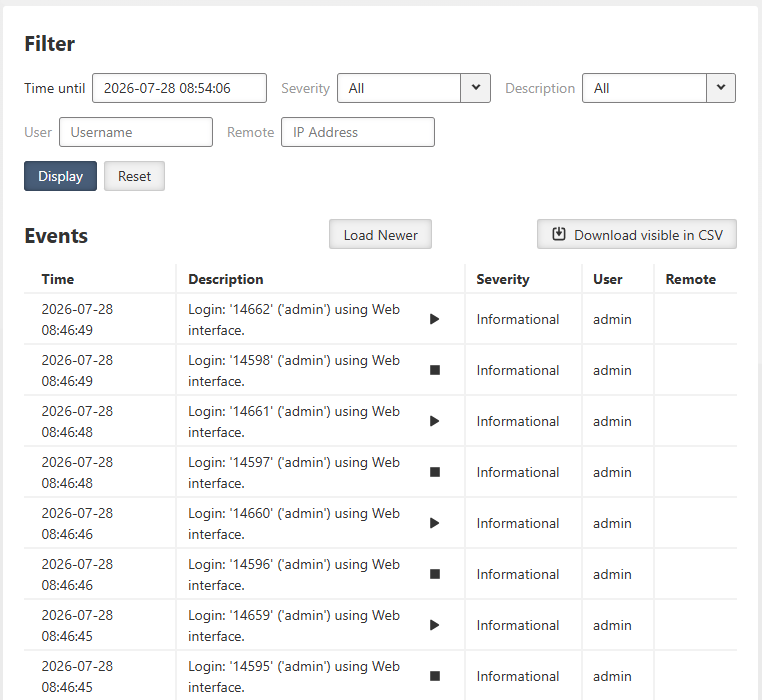
It is possible to change severities of individual events in the menu SETTINGS > Device > Events.
Tab. 5.3: Default Events level description
| Severity group | Level | Severity | Color code | Description | Action |
|---|---|---|---|---|---|
| ALARM | 0 | Emergency | Red | Faulty unit. HW repair is probably needed. | Replace the unit. Contact Technical support. |
| 1 | Alert | Red | Unit does not work. HW or SW problem. | Check the unit. Consult Technical support. | |
| 2 | Critical | Red | Serious error. Communication does not work. | Check the unit immediately. | |
| 3 | Error | Red | Error. Communication can work. | Check the unit. | |
| WARNING | 4 | Warning | Orange | Communication is OK. Self-healing action proceeded. | When often, consult with Technical support. |
| 5 | Notice | Blue | Security important action proceeded or I/O action. | Security check, the I/O status check. | |
| INFO | 6 | Informational | – | Informational item | Standard behavior |
| 7 | Debug | – | Debug info, if set so. | Debug |
WaSP unit permanently monitors various system ‘channels’. There are several types of those channels: Physical interfaces (Ethernet ports, serial ports, radio interface, additional module interface (e.g. LTE module) when installed), virtual interfaces (e.g. VLAN interfaces) and HW sensors (CPU temperature, supply voltage, …). Monitored values are stored in the internal database.
Statistics page provides aggregated statistical data from this internal database. Data can be both displayed and downloaded in CSV format. This file format is suitable to be imported to any 3rd party spreadsheet program for further analysis.
There are two different options how to display statistics data:
- Historical
Statistics counters are aggregated over the defined time interval. The interval is defined by two time stamps “From” and “To”.
- Differential
Statistics counters are aggregated between the counter reset and the current time (the moment when the Display button was pressed). Reset is triggered by a unit reboot or by the Reset statistics button.
Reset statistics button – initiates the Differential statistic counters reset. Such a reset does not affect normal statistic counters – i.e. the Historical statistics are not affected by such a Reset at all.
Length of statistics data
Statistics data are stored in the internal database. There is a fixed memory size allocated for the statistics data – the database is limited by number of records. As a result of this, the length of statistics history – how old records are available – depends on the actual network configuration: The more monitored values, the higher the rate of new recorded values, the shorter the available history.
Some sets of monitored values are constant (Ethernet ports and their counters) or do not rise to a high values (COM ports, Terminal servers and their counters). What affects the length of available history the most is the number of radio links – how many radio “neighbors” the unit communicates with or how many of the neighboring signals are received. This is different for each unit in the network.
Statistics data are always retrieved as aggregated for a certain time Interval. This Interval can be set by putting specific date and time into “From” and “To” fields, or using buttons “Last day”, “Last hour” or “More options” fast presets (from several minutes to several days). Button “Set Current Time” sets current time to both From and To fields to ease current unit status diagnostics.
There are following sets of statistical data available in the unit:
Radio interface statistics
Radio protocol statistics
Radio protocol non-addressable statistics
Radio signal statistics
Radio signal non-addressable statistics
Serial protocols statistics
Ethernet statistics
Cellular statistic
Measurements
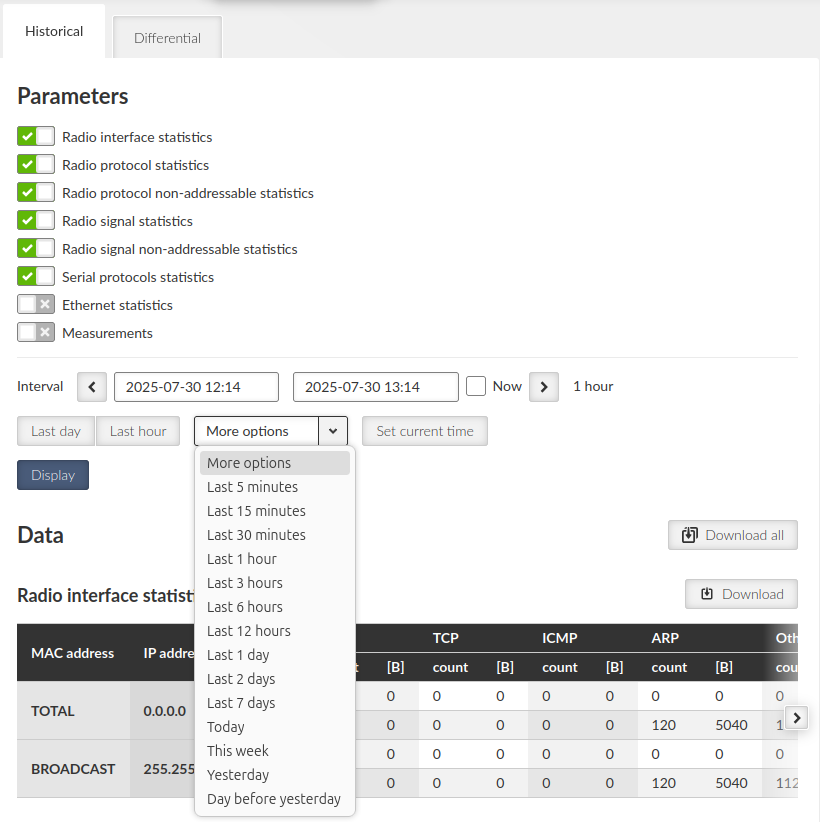
“Display” button then shows chosen data below. “Download Selected Data” button generates CSV (UTF-8 encoded) file of all chosen systems’ data and downloads them as files without displaying them. Both “Display” and “Download …” buttons send a request for the required set of statistics data to the unit. Retrieving and transferring of the data (over the radio channel) takes some time. Downloading the data is practical when the user needs to process them in a spreadsheet and wants to save some bandwidth. It is also recommended to use spreadsheet editor like Microsoft Excel or Apple Numbers to process statistics on mobile devices due to better user experience provided by the specialized apps.
Radio interface statistics provides set of data monitoring the interface between the Router module (IP routing engine in the unit) and the Radio protocol module. It corresponds to monitoring Radio – Router.
Tx direction: from the Router module to the Radio protocol module. Rx direction: from the Radio protocol module to the Router module.
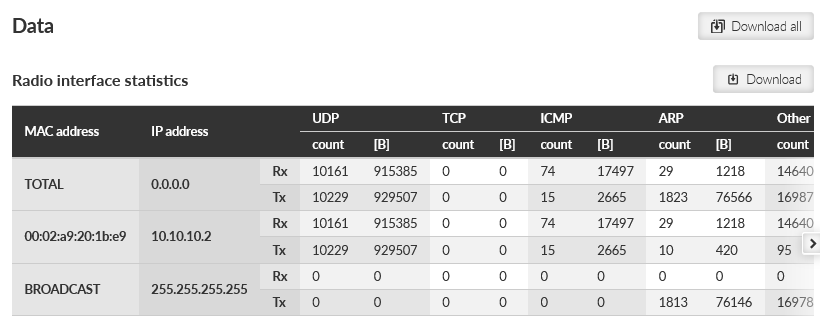
MAC address – MAC address of the IP packet. Source for Rx or destination for Tx packets.
IP address – translated MAC address when available. Address 0.0.0.0 is used as a placeholder if the translation is not available. If the Transparent protocol is used, the translation is not available at all.
UDP, TCP, ICMP, ARP – Packet count and amount of data in Bytes [B] for different protocol types. Amount of data is summed over the whole Layer 2 Ethernet frame (i.e. all IP headers are counted).
Other – Packets not handled by the previous counters (e.g. VLAN, services, GRE, IPsec (ESP), …)
Radio protocol statistics provides set of data monitoring the radio channel access protocol frames and events. It corresponds to monitoring Radio – Interface.
Frames which are not addressed to/from this unit are not handled (they do not affect any counter).
Rx direction: from the ‘air’ radio interface to the Radio protocol module. Tx direction: from the Radio protocol module to the radio interface.
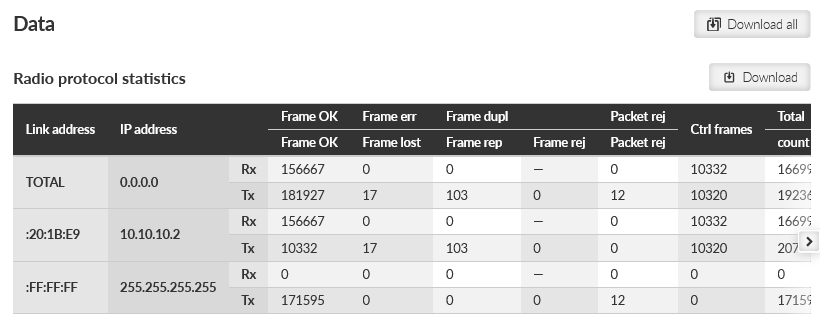
Link address – Link address of the frame. Source for Rx or destination for Tx frames. This is a Link address assigned at the origin (input) – when entering, or at the target (output) – when leaving the radio network.
This address pair is not modified when re-translated. As a result of this fact, the whole traffic to a remote station behind the re-translation is counted together in a line assigned to the remote station.
For the Link address:
IP address – translated MAC address when available. Address 0.0.0.0 is used as a placeholder if the translation is not available. If the Transparent protocol is used, the translation is not available at all.
Frame OK (Rx) – Correctly received data frames count.
Frame OK (Tx) – Correctly send data frames count. Control frames are not included. When ACK is on, only acknowledged frames are included. Re-translated data frames are not included.
Frame err (Rx) – Received corrupted data frames count (CRC error)
Frame lost (Tx) – Transmitted unacknowledged frames count. It happens when ACK is on and acknowledging frame was not received even when full number of re-transmission attempts was reached.
Frame dupl (Rx) – Received, but dropped, duplicated data frames count. ‘Duplicated’ frames are repeatedly received acknowledged frames.
Frame rep (Tx) – Repeated frames count (they can appear when ACK is on). Re-translated frames are not included.
Frame rej (Tx) – Rejected frames count (rejected just before transmission) – reason: buffer timeout. In case of Transparent protocol (Bridge mode) it happens when there is a collision during re-translation.
Packet rej (Rx) – Correctly received but rejected packets count – reason: impossible to decrypt or decompress.
Packet rej (Tx) – Rejected packets count (rejected before handed over to the transmitter) – reason: buffer overflow, buffer timeout.
Ctrl frames (Rx, Tx) – Received / transmitted control frames count.
Total (Rx) – Received frames count and amount of data in Bytes. Amount of data – for both Rx and Tx – is summed over the whole Layer 2 Ethernet frame (i.e. all IP headers are counted).
Total (Tx) – Transmitted frames count and amount of data in Bytes. Re-translated frames are included.
Radio protocol ‘non-addressable’ statistics provides set of data monitoring the radio channel access protocol frames and events which cannot be linked with any address (e.g. broadcasts). It corresponds to monitoring Radio – Interface.
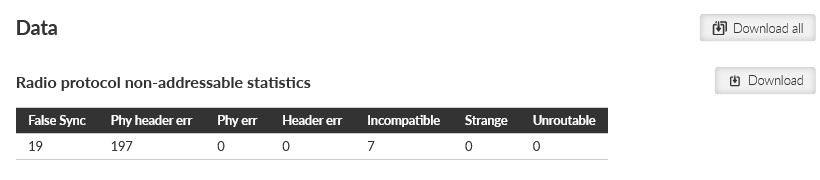
False Sync – False synchronization incidents count
Phy header err – Packet reception failure count – reason: sub header error
Phy err – Packet reception failure count – reason: physical layer analysis error
Header err – Packet reception failure count – reason: header content error or CRC error.
Incompatible – Received incompatible frames count – reason: different radio protocol
Strange – Received unexpected frames count – reason: wrong addresses, wrong sequence etc. Valid for Base Driven Protocol only.
Unroutable – Packets counter which were scheduled for transmission but impossible to be forwarded to the Radio protocol – multiple reasons: e.g. the destination IP address is not known
Radio signal statistics provides set of data monitoring the radio interface quantities and events. It corresponds to monitoring Radio – Interface.
Statistic data are collected by the frame source address – Link address, which is an address of the originating radio transmitter (unlike “Radio protocol statistics” where the Link address is an address of the unit where the packet entered the WaSP network).
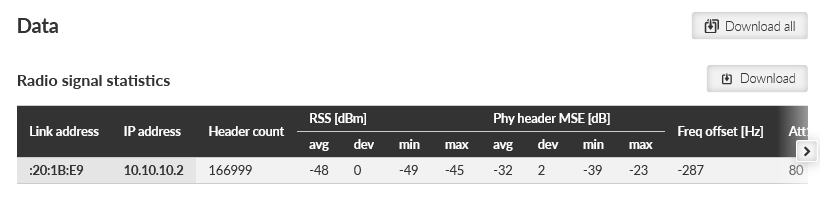
Header count – Received headers count
RSS [dBm] – Radio Signal Strength – measured within the header reception
avg / dev / min / max – average / standard deviation / minimum / maximum
Phy header MSE [dB] – modulation Mean Squared Error – measured within the header reception
Freq offset [Hz] – Averaged frequency offset between the transmitter and the receiver station, measured by the receiver station.
Att1 [%] – First internal attenuator (15 dB) activated. Shown in percents of affected frames.
Att2 [dB] – Value of the 2nd internal attenuation applied (0 – 31 dB).
Data count – Received complete frames (including data part) count. Frames with valid header CRC, but wrong data CRC are not counted
Data MSE [dB] – modulation Mean Squared Error – measured within the frame data part reception
Radio signal statistics provides set of data monitoring the radio interface quantities and events. This table contains measurements handled before the frame reception and measurements which cannot be linked with any address (e.g. broadcasts). It corresponds to monitoring Radio – Interface.
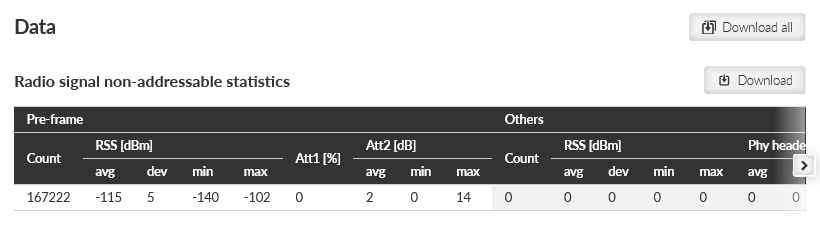
Pre-frame – Values based on measurements handled before the frame reception
RSS [dBm] – Radio Signal Strength – measured short time just before the frame reception
Others – Values for frames which cannot be linked with any address
Serial protocols statistics provides set of data monitoring the COM port(s) and Terminal server (s). Only enabled interfaces are displayed. The statistics counters are based on packets entering or leaving the COM port or Terminal server module. As a result of this the ‘count’ values correspond to the Protocol messages (the “Protocol” selected on the specific COM port or Terminal server). If the packet is ‘glued’ from the several frames, it is evaluated as a single packet. In case of COM port statistics, the summary of ‘Correct’ and ‘Drop’ Bytes provides the total amount of Bytes on the physical interface.
Rx direction: from the connected (at the COM or ETH port) external device to the WaSP unit (i.e. from the COM port module or Terminal server module to the Router module). Tx direction: from the WaSP unit to the external device.
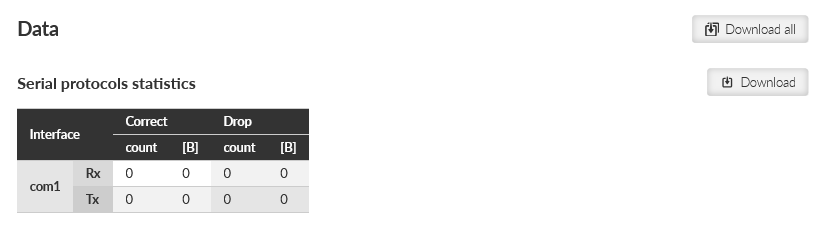
Interface – Interface name
Correct (Rx, Tx) – Correctly received / transmitted packets count and amount of data in Bytes. Accepted by the COM port or Terminal server module – based on the selected Protocol processing. Amount of data – for both Correct and Drop counters – is affected by COM port data only (i.e. IP headers of the UDP frames created in the COM port module are NOT counted).
Drop (Rx, Tx) – Dropped received / transmitted packets – reason: corrupted frame, CRC error, wrong protocol message, unsupported protocol message.
Ethernet statistics provides set of data monitoring the physical Ethernet ports. Only enabled interfaces are displayed.
Only correctly received frames are handled. The counters correspond to the specific IP protocol types.
Rx direction: from the physical Ethernet port to the WaSP unit (i.e. to the Router module). Tx direction: from the WaSP unit to the physical Ethernet port.
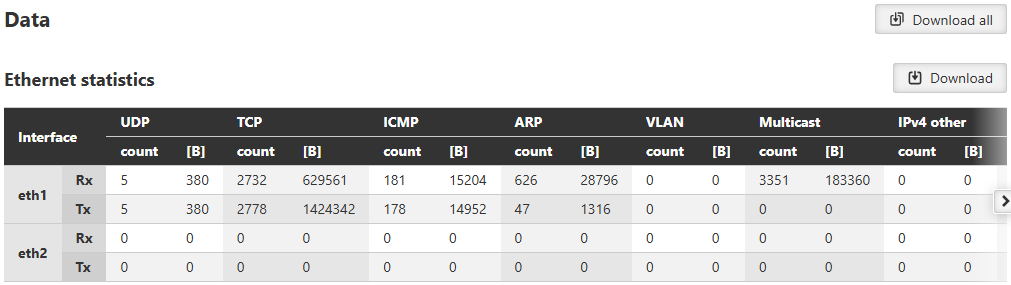
Interface – Interface name.
UDP, TCP, ICMP, ARP, VLAN, Multicast – Packet count and amount of data in Bytes [B] for different protocol types – IPv4 traffic. Amount of data – for all counters – is summed over the whole Layer 2 Ethernet frame (i.e. all IP headers are counted).
IPv4 other – IPv4 traffic not handled by the previous counters
IPv6 – IPv6 traffic counter
Other – Counter summing up the frames which were not handled by the previous counters – for example MPLS and GOOSE protocols.
Monitoring is an advanced on-line diagnostic tool, which enables a detailed analysis of communication over any of the WaSP router interfaces. In addition to all the physical interfaces (RADIO, EXT, ETHs, COMs, TSs), some internal interfaces between software modules can be monitored when such advanced diagnostics is needed.
Monitoring consists of two independent processes: settings of the monitored items and outputs. Please note that even if both of the outputs are switched off and some interfaces are set to On, the monitoring is still running in the background.
The monitoring screen has two main parts – Settings and Output
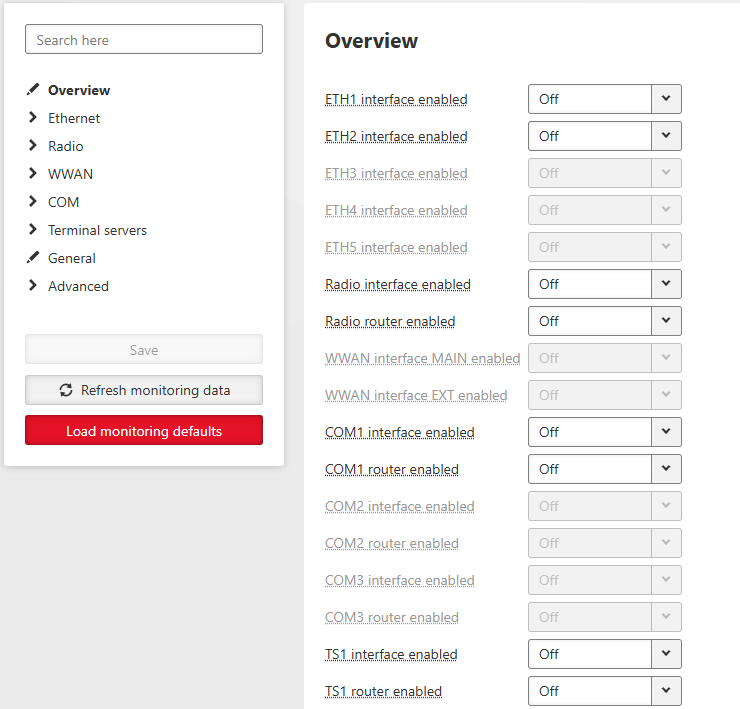
Save button – saves the new settings of the monitoring parameters.
Refresh monitoring data button – refreshes the settings menu according to the statistics status saved in the unit. The difference between the displayed and saved status can occur for example when the status is changed in different browser tab.
All status (On/Off) of individual interfaces are displayed on this place for quick overview on monitoring settings.
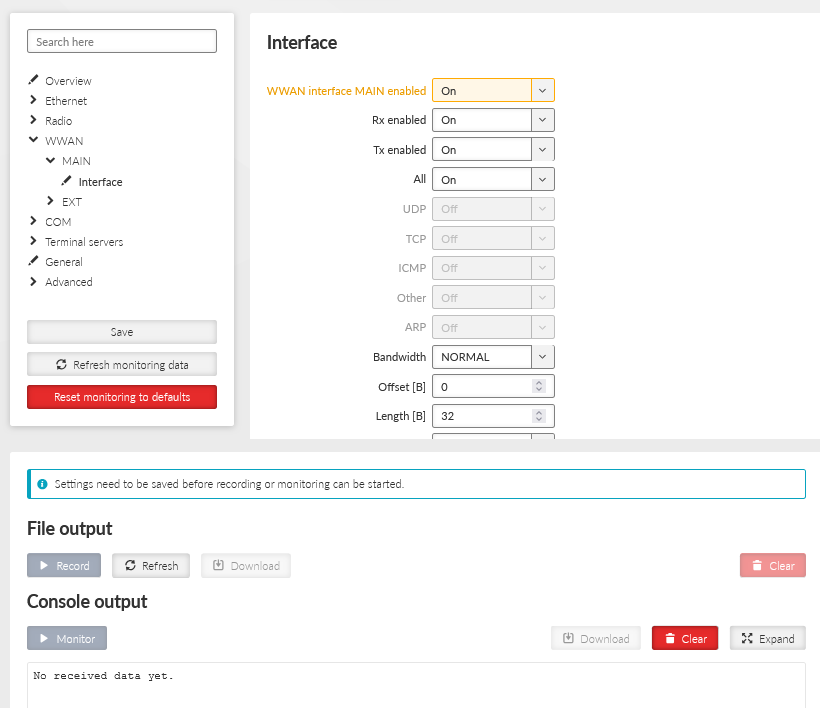
This section allows detailed settings of particular monitoring parameters for all interfaces.
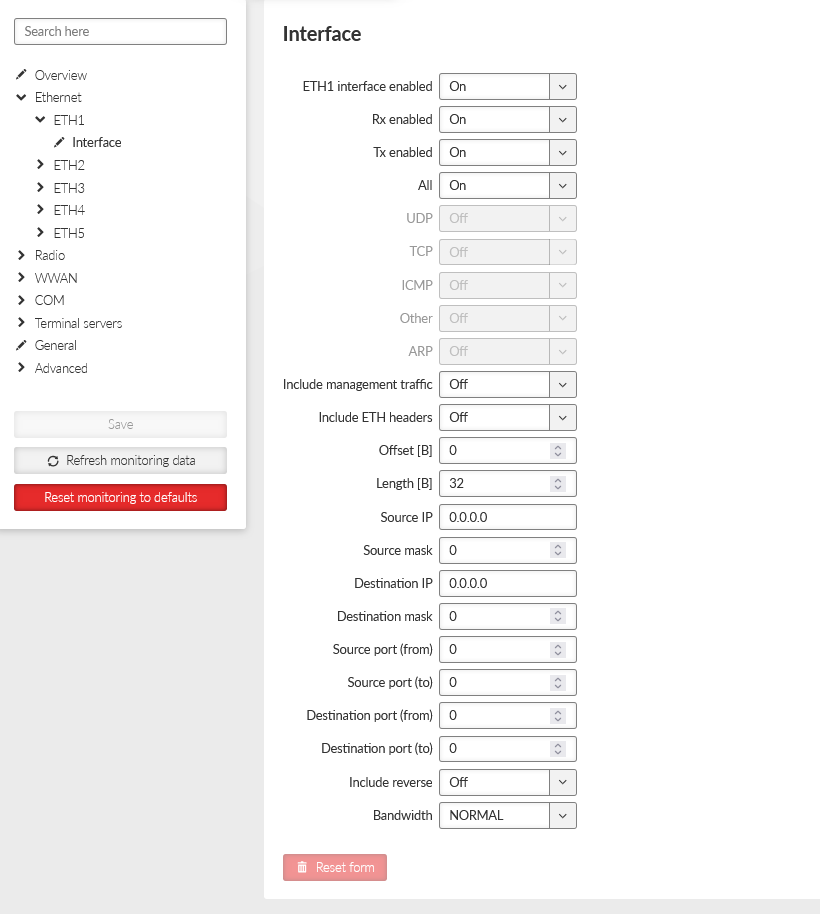
Common parameters for several interfaces:
- Rx enabled, Tx enabled
List box {On; Off}, default = “On”
A packet is considered a Tx one when it comes out from the respective software module (e.g. RADIO or Terminal Server) and vice versa. When an external interface (e.g. Interface COM) is monitored, the Tx also means packets being transmitted from the WaSP over the respective interface (Rx means “received”). Understanding the directions over the internal interfaces may not be that straightforward, please see ??? above for clarification.
- All
List box {On; Off}, default = “On”
Monitoring output can also be limited by IP protocol type. Select Off to be able to enable/disable specific protocol output individually – see next parameter(s).
- UDP / TCP / ICMP / Other / ARP
List box {On; Off}, default = “Off”
Monitoring output of specific IP protocol limitation.
- Offset [B]
Default = 0
Number of bytes from the beginning of packet/frame, which will not be displayed – the monitoring output is truncated by ‘Offset’ bytes at the beginning of the message.
- Length [B]
Default = 32
Number of bytes to be displayed from each packet/frame.
Example: Offset=2, Length=4 means, that bytes from the 3rd byte to the 6th (inclusive) will be displayed:
Data (HEX): 01AB 3798 A285 93CD 6B96
Monitoring output: 3798 A285
- Bandwidth
List box {LOW; NORMAL; HIGH; UNLIMITED}, default = “NORMAL”
Monitoring bandwidth limit to prevent overload of management link between client PC and the WaSP unit. LOW (up to ~300 kb/s), NORMAL (up to ~800 kb/s), HIGH (up to ~2 Mb/s), UNLIMITED (up to ~8 Mb/s)
- Source port (from) / Source port (to)
TCP/UDP source port to be enabled/disabled in the monitoring output. Use these parameters to specify the source range of ports <from – to>.
- Destination port (from) / Destination port (to)
TCP/UDP destination port to be enabled/disabled in the monitoring output. Use these parameters to specify the destination range of ports <from – to>.
- Dropped frames
List box {On; Off}, default = “Off”
When On, monitoring shows frames which are dropped (e.g. CRC is not valid, buffer overflow, …).
- Include management traffic
List box {On; Off}, default = “Off”
Enable/disable management packets monitoring output.
- Include ETH headers
List box {On; Off}, default = “Off”
Displays (enable) / omits (disable) L2 headers in the monitoring output.
- Include reverse
List box {On; Off}, default = “Off”
Enable/disable reverse traffic (e.g. TCP reply to a request) monitoring.
- Source IP / mask, Destination IP / mask
Monitoring output can also be limited to a specific address range – Source and Destination IP address and mask can be used to define the required range.
- Corrupted frames
List box {On; Off}, default = “On”
Corrupted (“header CRC error”, “data CRC error”, etc.) received frames monitoring output can be suppressed. This can be useful when the communication in the channel is heavily disturbed by interference or noise, resulting in „garbage” messages which can make the monitoring output difficult to read.
- Other modes
List box {On; Off}, default = “Off”
When Promiscuous mode is enabled, the unit is capable to monitor (receive) frames from the other WaSP units even if the other unit(s) is(are) working in the other Unit mode (Bridge versus Router).
Frames transmitted under another Unit mode may not be properly ‘analyzed’. In such a case frames are displayed in raw data format.
- Include headers (Router)
List box {None; Packet (IP); Frame (ETH)}, default = “None”
None – Only the payload (L4) is displayed, e.g. the data part of a UDP datagram.
Packet (IP) – Headers up to a Network layer (L3) are included, i.e. the full IP packet is displayed.
Frame (ETH) – The full Ethernet frame (L2) is displayed, i.e. including the ETH header.
- Include headers (Interface)
List box {None; Radio link; Data coding; Both}, default = “None”
None – no headers will be displayed
Radio link – radio link headers will be included into the monitoring output
Data coding – data coding header will be included, where C: type of compression, E: type of encryption
Both – both Radio link and data coding headers will be included
- Promiscuous mode
List box {On; Off}, default = “Off”
Off – only frames which are normally received by this unit, i.e. frames whose Radio IP destination equals to Radio IP address of this WaSP unit and broadcast frames are available for the monitoring. Monitoring filters are applied afterwards.
On – all frames detected on the Radio channel are available for the monitoring. Monitoring filters are applied afterwards.
- Link Control Frames
List box {On; Off}, default = “Off”
Off – Radio Link Control Frames (e.g. ACK frames) are never displayed.
On – Radio Link Control Frames are processed by monitoring. Monitoring filters are applied.
- Source IP / mask, Destination IP / mask (router)
Monitoring output can also be limited to a specific address range – Internal (router) Source and Destination IP address and mask can be used to define the required range.
- Source IP / mask, Destination IP / mask (radio)
Monitoring output can also be limited to a specific address range – Radio interface Source and Destination IP address and mask can be used to define the required range.
- Include reverse / Include Radio reverse
Includes reverse traffic for source / destination settings.
Menu DIAGNOSTICS > Monitoring > Advanced groups together all setting across all monitoring web pages, mentioned above, in one web page.
Extended measurement
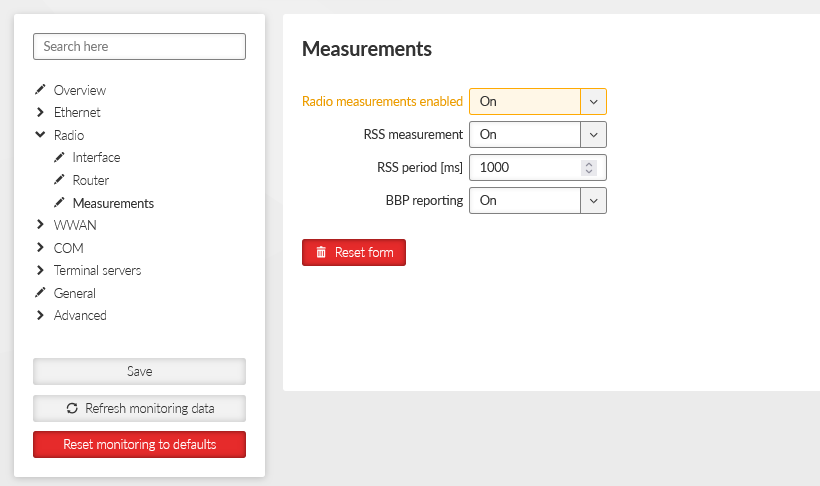
Monitoring now includes additional parameters such as modulation type, FEC code, RF power, and temperature for TX, as well as modulation type, FEC code, frequency offset, and pre-packet RSS for RX.
Monitors regular measurements of radio channel and HW variables.
Individual measurements can be switched on and off, or the measurement period can be modified.
The signal strength is measured at the receiver at the set interval, regardless of any ongoing activity—even during transmission.
The BBP reporting function is included, providing the measured integrated power level across the entire bandwidth.
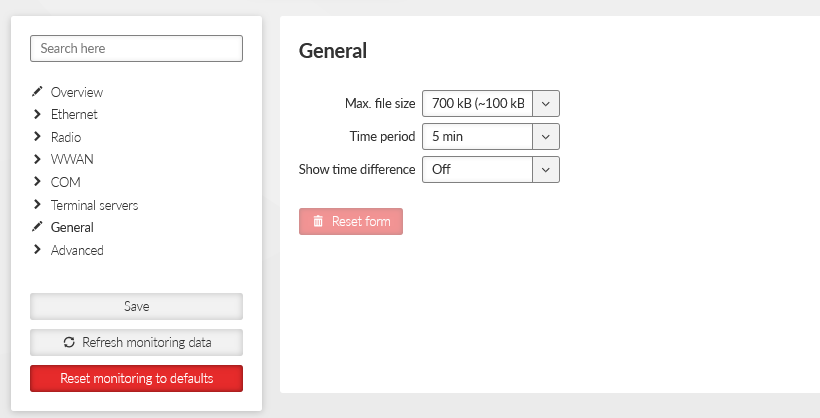
The settings of output parameters for file output – Max. file size and Time period, the first parameter matched closes the monitoring file. File is saved in compressed way, so the uncompressed and approximate compressed size is displayed in the list box.
- Max. file size
List box {7 kB (~1 kB); 70 kB (~10 kB); 358 kB (~50 kB); 700 kB (~100 kB); 3 MB (~500 kB); 7 MB (~1 MB); max (~2 MB)}, default = “700 kB (~100 kB)”
- Time period
List box {1 min; 2 min; 5 min; 10 min; 20 min; 30 min; 1 hour; 3 hours; 24 hours; Off}, default = “5 min”
- Show time difference
List box {On; Off}, default = “Off”
When On, the time difference between subsequent packets is displayed in the monitoring output.
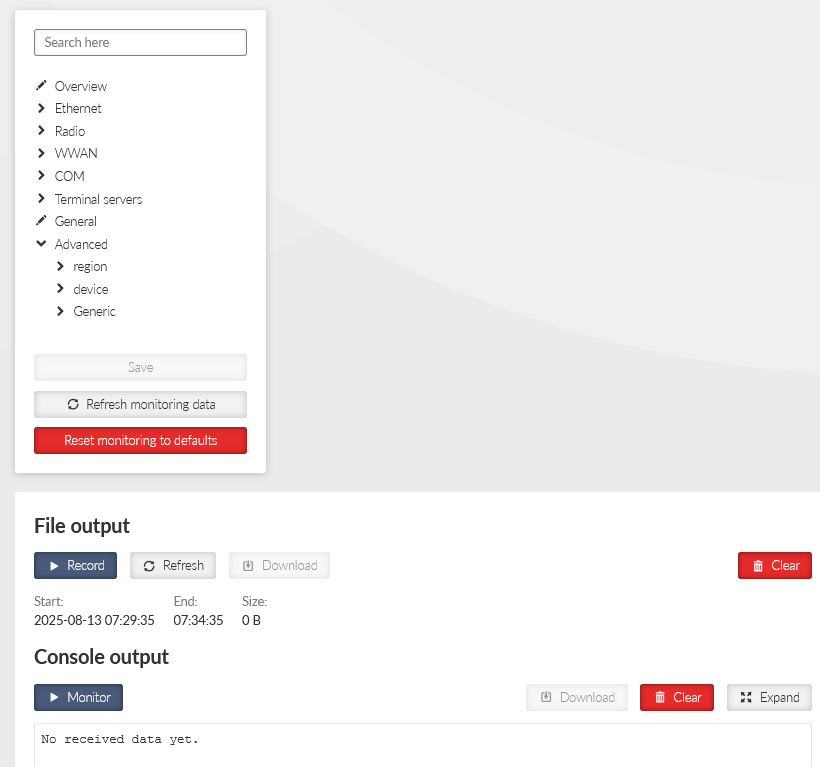
Record button – starts recording to the file. Triggers a process, which is set by parameters in the chapter above (Section 5.6.1.3, “General”).
Stop recording button – stops recording to the file. The recording will be stopped immediately regardless of the size and time of recording. When the Record button is pressed for the second time the previously recorded data will be cleared.
Refresh button – refreshes the information about time remaining and size of the recorded data (in uncompressed way).
Download button – downloads file to a connected computer. The default name contains of the Unit name, date and time of the begin and day and time of the end of the monitoring. Before downloading you have to stop recording.
Clear button – allows to clear the monitoring data stored in the unit – both downloaded or not downloaded.
Monitor / Stop monitoring button
Download button – downloads the content of the console output as a file
Clear button – clears Console output screen
| Note |
|---|---|
If the amount of monitored data exceeds the limit (2.7 kB for remote monitoring and 32 kB for local monitoring) for one time period (approx. 1 s), some data will not be displayed in the console output. A note about the omited data will be inserted to the console output to the position of the non-displayed data. |
Set of diagnostic tools
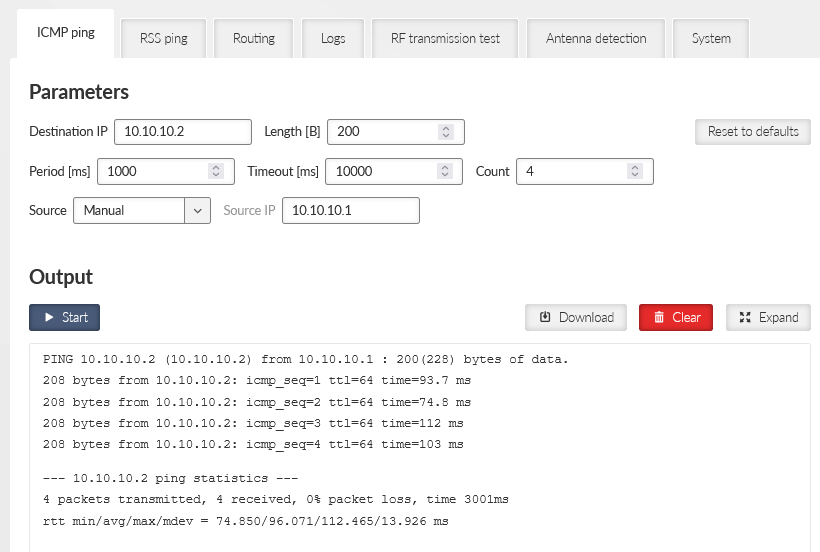
All parameters used by standard ICMP ping are available. Start / Stop button starts / stops pinging.
(WaSP / WaSP combination)
RSS ping is a diagnostic tool for the radio performance measurement (Radio Signal Strength and modulation Mean Squared Error) of the individual radio hops within a WaSP network. Hybrid networks are supported. Output format of different type (other than radio) of hops is similar to ICMP ping.
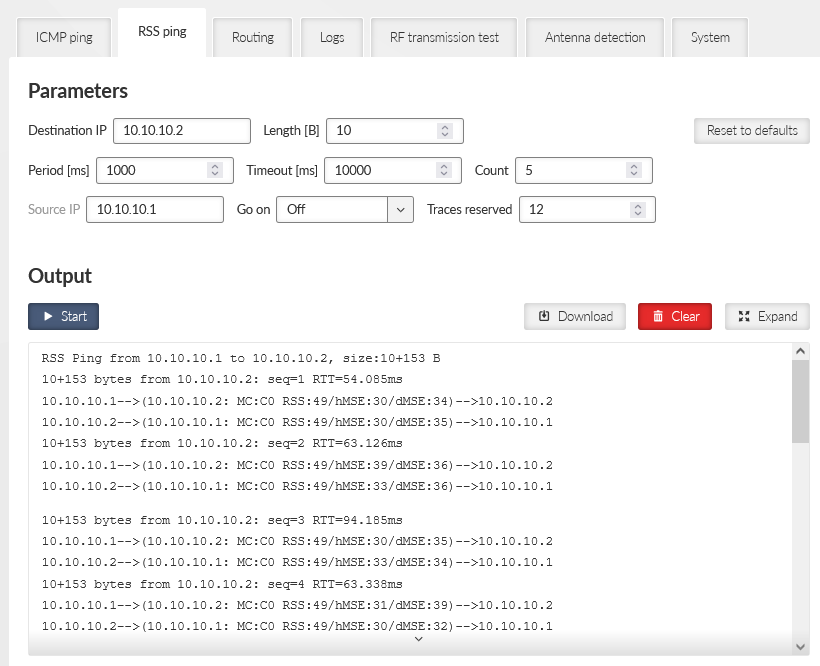
- Destination IP
Destination IP address. This address must belong to a WaSP unit as the RSS ping can be initiated only between two WaSP units.
- Length [B]
Number {8 – 1500}, default = 10
The length of data used by RSS ping. In case the length of RSS ping packet is longer than the length of Radio interface MTU, the first RSS ping packet will be lost and will cause decreasing of the packet length to the value matching to the current radio MTU. Random data are used as a payload.
- Period [ms]
Number {100 – 3 600 000}, default = 1000
Period of sending RSS ping packets
When the period is set to a shorter number than the actual RTT, collisions might appear (depends on the selected Radio protocol). In order to reach the shortest possible period enable the Go on mode.
- Timeout [ms]
Number {100 – 3 600 000}, default = 10000
Response timeout
- Count
Number {1 – 10000}, default = 5
Number of RSS pings to be send
- Source IP
The local IP address of WaSP unit originating RSS ping. Blank field (equal to 0.0.0.0 address) is used to assign the source address automatically – address is assigned automatically according to the routing rules.
- Go on
List box {On; Off}, default = “Off”
Go on mode. When Enabled, RSS pings are sent immediately after receiving the RSS ping reply (Period parameter is ignored).
- Traces reserved
The RSS ping also contains data about the route (RSS, MSE), this parameter allows to set number of radio hops within the network to be measured. Radio hop is measured in both directions, so the number has to be higher than number of hops in route multiplied by 2 (for example: link consisting of 2 radio hops needs 5 traces to be reserved).
- Output:
MC – Encodes Modulation and Coding – see transcription table:
Tab. 5.4: Translation table for Modulation rates and FEC
Modulation FEC 00 2CPFSK FEC off 01 FEC 3/4 10 4CPFSK FEC off 11 FEC 3/4 RSS – Radio Signal Strength [dBm] – measured within the header reception
hMSE – Phy header modulation Mean Squared Error [dB] – measured within the header reception
dMSE – Data modulation Mean Squared Error [dB] – measured within the frame data part reception
Routing tool provides the next hop routing information of the given IP address.
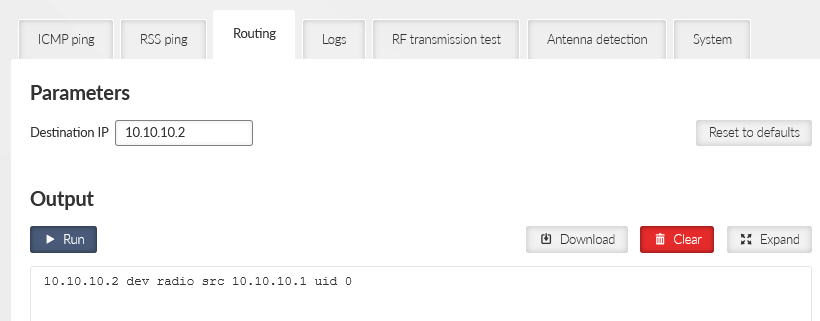
- Destination IP
The examined IP address.
- Output
Output section provides the following details:
Examined address (example: 8.8.8.8)
Next hop (gateway) address (example: via 192.168.141.254)
Next hop interface (example: dev if_bridge)
Outgoing packet Source address (example: src 192.18.141.210)
This tool provides a real-time display of process logs for active device operations. These logs are designed for live station diagnostics and do not offer historical data retrieval. For retrospective analysis, please utilize an alternative method, such as the Diagnostic package.
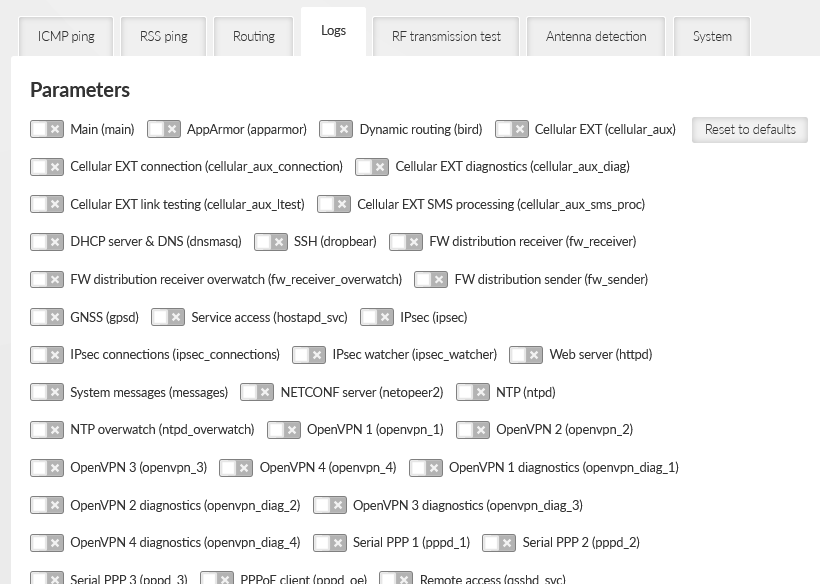
The core functionalities of this tool include:
Real-time record display.
Support for multiple independent instances (up to 10).
Consolidated display of records from any number of processes within a single instance.
Record filtering based on specified severity levels.
Record length limitation to 1024 characters, with truncation of longer entries.
- RF transmission test
Pre-defined type of RF signal can be transmitted for a specific purpose.
Type
List box {Random data; Carrier wave; Single tone}, default = “Random data”Type of transmitted signal during the test. In case of Single tone a frequency with an offset from the central frequency is transmitted.
Period [s]
Number {1 – 120 s}Transmission test pre-set duration.
Start button
Starts the transmission test. If “Start” is requested during running test, it will not be launched again, but an error value will return. Currently running test will finish its time period.Stop button
Allows to stop the test before the pre-set time. If “Stop” is requested and there is no running test, and error value will return.
| Note |
|---|---|
Testing is only allowed without standard radio protocol. Please set “Radio protocol” to “None” in Radio Settings before using this feature. |
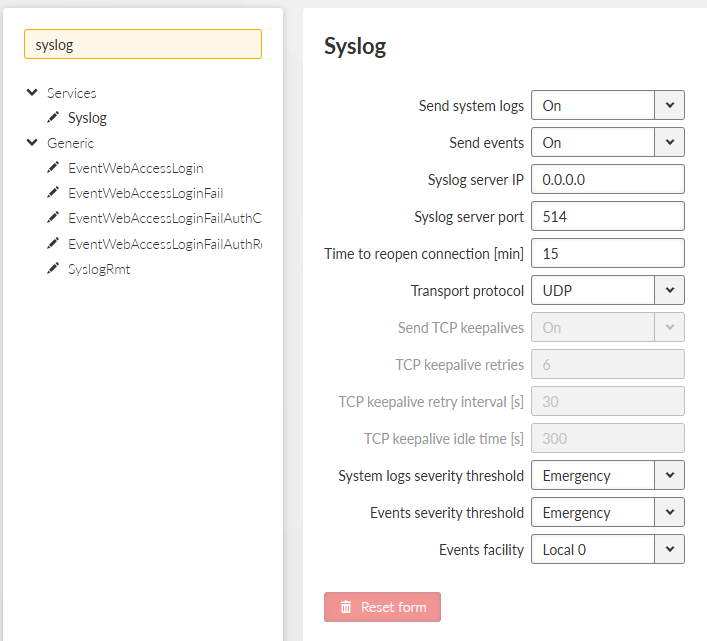
- SYSLOG server IP
IP address of the remote Syslog server to which logs will be sent with severity higher than severity set in the Max. severity
- SYSLOG server Port
Port used by the Syslog server
- Max. severity
List box {Off; 0 Emergency; 1 Alert; 2 Critical; 3 Error}, default= ”Off”
Off – switches off the SYSLOG functionality
Only the events with set severity (and higher) will be sent to the Syslog server. Severities for individual Events can be set in Section 4.6.3, “Events”.
- Login attempt
List box {Off; Web}, default = “Off”
Switches whether login attempts (both successful and unsuccessful) will be sent to the SYSLOG server.