Before a microwave link can be installed, an analysis and calculation of the microwave link must be made first. The analysis should take place before the site survey itself to get a clear idea about the dimensions of the antennas. The analysis consists of the following steps:
Free space loss calculation
Link budget calculation
Rain attenuation
Multipath fading
Fade margin
Fresnel zones calculation
This chapter explains the individual steps and an example of link design is given at the end.
NOTE – For quick reference you can use the calculator on www.racom.eu
As the electromagnetic waves travel through open space they are attenuated. This attenuation is described as Free-space Loss. This loss depends on the distance travelled by signal and its frequency. Both parameters are in direct proportion. Longer distance means greater attenuation and higher frequency means greater attenuation. Free-space loss can be calculated thus:
FSL = 32.44 + 20log f + 20log D
Where:
FSL | free-space loss (dB) |
f | frequency of the emitted signal (MHz) |
D | length of the link (km) |
To goal is to design a link so that the received signal is stronger than the receiver’s sensitivity at the required BER (typically 10-6). Since every radio signal in earth atmosphere is subject to fading, some difference between received signal level under normal circumstances and receiver sensitivity is needed to serve as a fade margin. The minimum value of fade margin can be calculated from the requirement for link availability (typically 99.999% of the time). The required margin depends on the length of the link as well as other factors such as rain attenuation, diffraction and multipath propagation.
If we ignore the additional loss along the path, the received signal strenght can be calculated using the formula for signal propagation in free space as follows:
PR = PT + GT + GR – FSL
Where
PR | received power level (dBm) |
PT | transmitted power (dBm) |
GT | transmitting antenna gain (dBi) |
GR | receiving antenna gain (dBi) |
FSL | free space loss (dB) |
PR must be:
PR > PS
Where:
PS | receiver sensitivity (dBm) |
The receiver’s sensitivity defines the minimum level of the received signal at which the receiver is able to process the received signal without losses or affecting the transmitted data (for BER better then 10-6).
Determining sufficient fade margin is the most important step in microwave link design. If the margin is too small, the link will be unstable – as a result, sufficient availability of the link or quality of the provided services cannot be guaranteed. On the other hand, unnecessarily large margin makes the link more expensive (higher performance, larger and more expensive antennas) and increases the cost of creating the microwave link.
The following paragraphs describe the two most significant types of attenuation – rain and multipath attenuation, which are the most frequent along with free space loss. Mutual relation between rain and multipath attenuation rules out the possibility that the link could be affected by both types of attenuation at the same time – these types of attenuation do not add up. To determine the fade margin it is necessary to calculate both rain and multipath attenuation. The larger of the two types of attenuation determines the value of fade margin. In areas with high precipitation, rain attenuation can be expected to be more prominent. By contrast, links located in drier climates and little inclination, will suffer more from multipath attenuation.
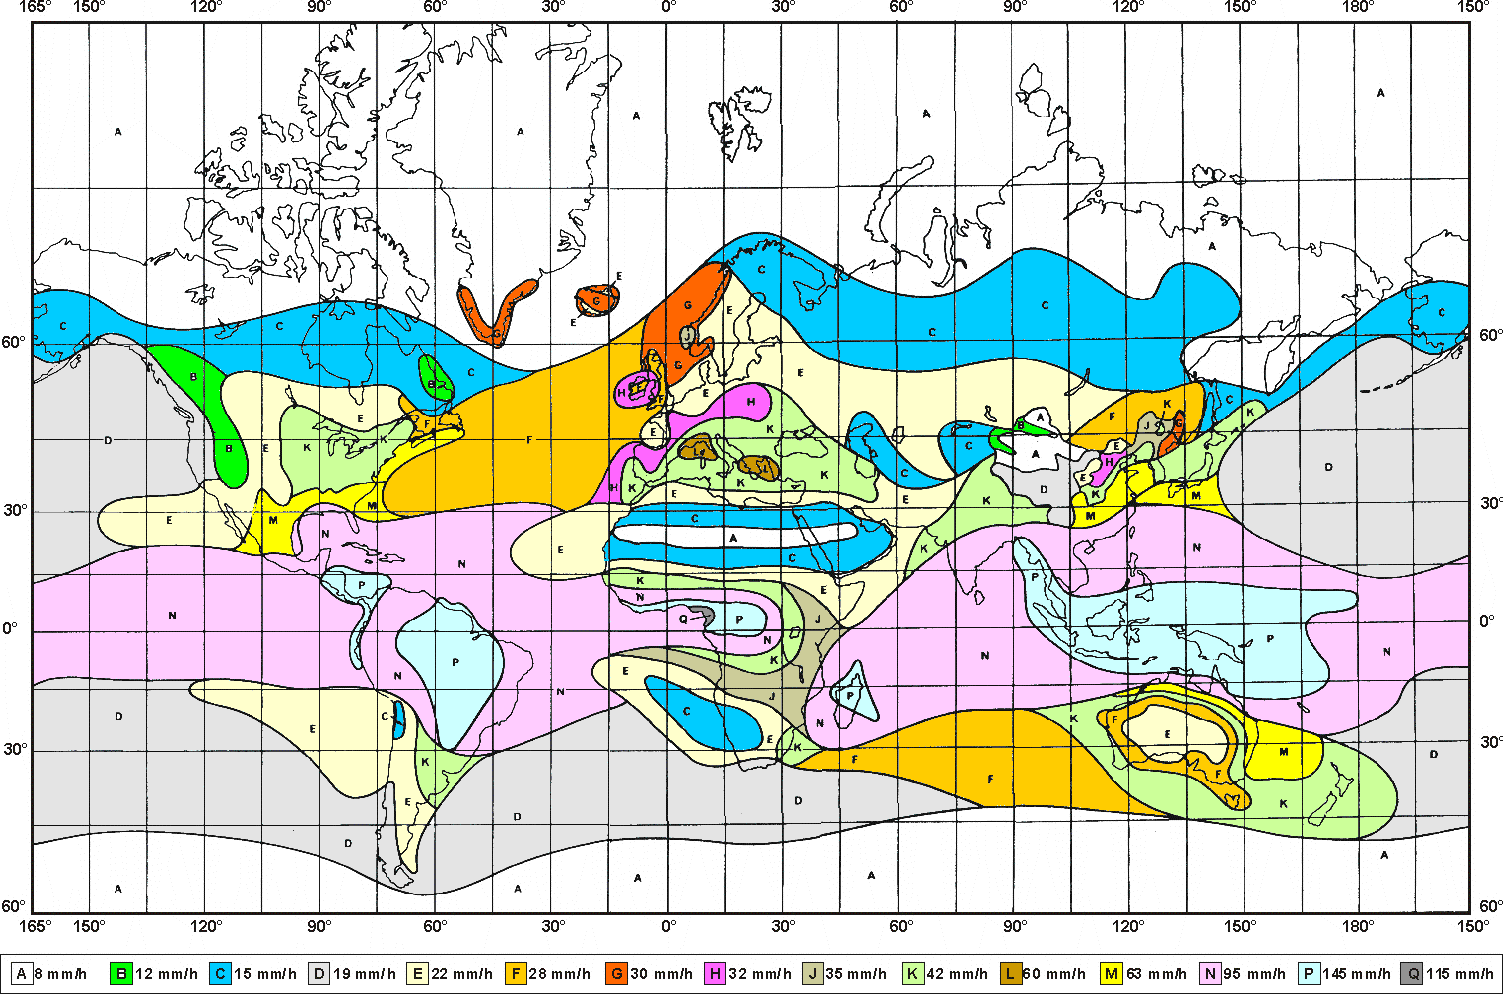
FSL is not the only attenuation that influences the emitted signal. For frequency ranges upward of 10 GHz rain attenuation also plays a role. Precipitation is not identical in all areas which is why ITU released a recommendation Rec. ITU-R PN.837-1 for splitting into 15 regions according to precipitation intensity see Fig. 2.1, for more detail Appendix B, Rain Zone Map. In the areas with higher precipitation greater rain attenuation must be expected and a greater signal fade margin must be established, see the calculation of link availability.
The following properties are inherent to rain attenuation:
It increases exponentially with rain intensity
It becomes significantly larger as the distance travelled increases (>10 Km)
Horizontal polarization causes greater rain attenuation than vertical polarization
Rain outage increases dramatically with frequency and path length
Raid attenuation can be calculated using ITU-R outage model, which consists of the following:
Obtain the rain rate R0.01 exceeded for 0.01 per cent of the time (with an integration time of 1 min). R0.01 values are defined for 15 rain zones and different time percentages and they are given in ITU-R Recommendation P.837.
Tab. 2.1: Rain rate R (mm/h) ITU-R P.837
| Percentage of time (%) | A | B | C | D | E | F | G | H | J | K | L | M | N | P | Q |
|---|---|---|---|---|---|---|---|---|---|---|---|---|---|---|---|
| 1.0 | <0.1 | 0.5 | 0.7 | 2.1 | 0.6 | 1.7 | 3 | 2 | 8 | 15 | 2 | 4 | 5 | 12 | 14 |
| 0.3 | 0.8 | 2 | 2.8 | 4.5 | 2.4 | 4.5 | 7 | 4 | 13 | 42 | 7 | 11 | 15 | 34 | 49 |
| 0.1 | 2 | 3 | 5 | 8 | 6 | 8 | 12 | 10 | 20 | 12 | 15 | 22 | 35 | 65 | 72 |
| 0.03 | 5 | 6 | 9 | 13 | 12 | 15 | 20 | 18 | 28 | 23 | 33 | 40 | 65 | 105 | 96 |
| 0.01 | 8 | 12 | 15 | 19 | 22 | 28 | 30 | 32 | 35 | 42 | 60 | 63 | 95 | 145 | 115 |
| 0.003 | 14 | 21 | 26 | 29 | 41 | 54 | 45 | 55 | 45 | 70 | 105 | 95 | 140 | 200 | 142 |
| 0.001 | 22 | 32 | 42 | 42 | 70 | 78 | 65 | 83 | 55 | 100 | 150 | 120 | 180 | 250 | 170 |
Compute specific attenuation γR (dB/km) for the frequency, polarization, specific rain rate using ITU-R recommendation P.838. Rain attenuation for rain rate γR0.01 can be calculated as follows:
γR0.01 = kh,v .R0.01αh,v
where:
kh,v, αh,v | constants for horizontal and vertical polarization. Constants are slightly different for each polarization. For 10 GHz band constants are in table 2.3. |
Tab. 2.2: Constants k, α for horizontal and vertical polarization at 10 GHz
| kh | αh | kv | αv |
| 0.01217 | 1.2571 | 0.01129 | 1.2156 |
Fig. 2.2, “Specific rain attenuation γR0.01 (dB/km) for H, V polarization and rain zones at 10 GHz” shows that rain attenuation is greater for horizontal polarization. In regions with higher precipitation the difference in attenuation is more marked. This is why it is almost necessary to use vertical polarization and sufficient fade margin when designing links in high precipitation environment (regions K through Q).
Multipath fading is another dominant fading mechanism for 10 GHz frequency. A reflected wave causes a phenomenon known as multipath, meaning that the radio signal can travel multiple paths to reach the receiver. Typically, multipath occurs when a reflected wave reaches the receiver at the same time in opposite phase as the direct wave that travels in a straight line from the transmitter.
Multipath propagation gives rise to two kinds of signal degrading effects, i.e., flat fading and frequency selective fading. A flat fading is a reduction in input signal level where all frequencies in the channel of interest are equally affected and there is dependent on path length, frequency, and path inclination. In addition, it is strongly dependent on the geoclimatic factor K.
To calculate the probability of outage due to multipath propagation of microwave links in the 10 GHz band can be used ITU-R probability model which describes a single frequency (or narrowband) fading distribution suitable for large fade depths A in the average worst month in any part of the world (based on ITU-R p.530-12)5 and for detailed link design is given as follows [1]:
P0 = Kd3.2(1+|εP|)-0.97×100.032f-0.00085hL–A/10
where:
d | link distance (km) |
f | frequency (GHz) |
hL | altitude of lower antenna (m) |
A | fade depth (dB) |
K | is geoklimatic factor and can be obtained from: |
K = 10-4.2-0.0029dN1
The term dN1 is provided on a 1.5° grid in latitude and longitude in ITU-R Recommendation P.453. The data are available in a tabular format and are available from the Radiocommunication Bureau (BR)
From the antenna heights he and hr (meters about sea level), calculate the magnitude of the path inclination │εP│ (mrad) using the following expression:
where:
d | link distance (km) |
hr, he | antenna heights above sea level (m) |
The position of obstacles between points of the bridge can significantly influence the quality of the microwave link. The radio signal doesn’t only radiate along the line of sight, but also in the area around it, i.e. in the so-called 1st Fresnel zone. Within this zone 90 % of the energy is transmitted between the transmitter and receiver antenna. This space has the shape of an ellipsoid. If it is disturbed the link has worse transmission properties and a higher quality antenna is required. For this reason the position of the antenna can be just as important as its height above ground. 60 % of the 1st Fresnel zone is considered as the most important.
The general equation for calculating the first Fresnel zone radius at any point P in between the endpoints of the link is the following:
Where:
F1 | first Fresnel Zone radius in metres |
d1 | distance of P from one end in metres |
d2 | The distance of P from the other end in metres |
λ | wavelength of the transmitted signal in metres |
The cross sectional radius of each Fresnel zone is the highest in the center of link, shrinking to a point at the antenna on each end. For practical applications, it is often useful to know the maximum radius of the first Fresnel zone. From the above formula can be simplified calculation of the first Fresnel zone.
where:
r | radius of first Fresnel zone (m) |
D | total link distance (km) |
f | frequency (GHz) |
Tab. 2.3: 60 % of the 1st Fresnel zone for 10 GHz
| Length of link D | Radius of zone r |
| 0,5 km | 1.16 m |
| 1 km | 1.64 m |
| 2 km | 2.32 m |
| 4 km | 3.28 m |
| 6 km | 4.02 m |
| 8 km | 4.64 m |
| 10 km | 5.19 m |
| 15 km | 6.35 m |
| 20 km | 7.33 m |
| 50 km | 11.60 m |
Link parameters:
Link distance: 15 km
First antenna height above sea level: 295 m
Second antenna height above sea level: 320 m
Location: Central Europe (rain zone B, refraction gradient dN1= −200)
Transmission requirements:
Required data rate: 170 Mbps
Required availability: 99.99 %
RAy parameters:
100 Mbps -> Modulation 256QAM; BW=28 MHz; PS(BER 10-6)= −67 dBm
Tx power 10 dBm (max. Tx power)
Antenna gain:
60 cm … 34.6 dBi
90 cm … 38.0 dBi
120 cm … 40.1 dBi
| Step 1 – Free space loss calculation | ||
| FSL = 32.44 + 20log f + 20log D = 32.44 + 20log10·103 + 20log15 = 135.9 dB | ||
| Step 2 – Rain attenuation | ||
| For 99.99% availability in rain zone B the rain rate is R0.01=12 (see Fig. 2.1) | ||
| For f=10 GHz kh=0.01217; αh=1.2571; kv=0.01129; αv=1.2156 | ||
| Vertical polarization: | ||
| γR0.01 = kv .Rαv0.01 = 0,01129 · 121.2156 = 0.23 dB/km => for 15km distance 3.47 dB | ||
| Horizontal polarization | ||
| γR0.01 = kh .Rαh0.01 = 0,01217 · 121.2571 = 0.28 dB/km => for 15km distance 4.15 dB | ||
| Step 3 – Attenuation due to multipath propagation | ||
| We have to find required fade margin for reliability of the link 99.99 percent. | ||
| Path inclination: | ||
 | ||
| The percentage of time that fade depth A (dB) is exceeded in the average worst month is calculated as: | ||
P0 = Kd3.2(1+|εP|)-0.97×100.032f-0.00085hL–A/10 | ||
| P0 = 10-4.2-0.0029×(-200)×153.2(1+|1.67|)-0.97×100.032×10-0.00085×295–A/10 | ||
| P0 = 0.537×100,0692–A/10 | ||
| For reliability 99.99% is P0=0.01 we get exponential function for A: | ||
 | ||
| The minimum fade margin required to suppress multipath fading on this link would be 18 dB. | ||
| Step 4 – Link budget calculation | ||
| Calculation in steps 2 and 3 determines the minimum fade margin required for stable link operation as 18 dB (multipath attenuation is dominant). If you use the maximum performance of antenna with diameter of 60 cm, complete the radio formula as follows: | ||
PR = PT + GT + GR − FSL = 10 + 34.6 + 34.6 − 135.9 = −56.7 dB | ||
| Fade margin: | ||
A = |PS| − |PR| = 67 − 56.7 = 10.3 dB | ||
| The resulting fade margin is lower than the required 18 dB. Therefore, it is necessary to either increase the output or use larger antennas (120 cm and 90 cm). The calculation would then be as follows: | ||
PR = PT + GT + GR − FSL = 10 + 40.1 + 38 − 135.9 = −47.8 dB | ||
| Fade margin: | ||
| A = |PS| − |PR| = 67 − 47.8 = 19.2 dB | ||
| The fade margin is now sufficient. 99.99% reliability is ensured for the required speed of 170 Mbps. Technical literature often gives the minimum fade margin of 20 dB. For very long links (more than 10 km) fade margin will, indeed, be approximately 20 dB. For shorter links, however, such large margin is not necessary. It is helpful to first conduct the calculation above to receive an idea of the attenuation affecting the link. | ||
| The result | ||
| To achieve the required transmission speed and availability 10 dBm output and antenna size of 120 cm, resp. 90 cm, will be necessary. | ||
Sources for Chapter 2, Implementation Notes:
[1] Lehpamer, H.: Microwave transmission network, Second edition, ISBN: 0071701222, McGraw-Hill Professional, 2010.ITU-R recommendation used:
ITU-R P.837-5 – Characteristics of precipitation for propagation modelling
ITU-R P.530-12 – Propagation data and prediction methods required for the design of terrestrial line-of-sight systems
ITU-R P.453-9 – The radio refractive index: its formula and refractivity data